Food Lion 2012 Annual Report Download - page 70
Download and view the complete annual report
Please find page 70 of the 2012 Food Lion annual report below. You can navigate through the pages in the report by either clicking on the pages listed below, or by using the keyword search tool below to find specific information within the annual report.-
 1
1 -
2
-
3
-
4
-
5
-
6
-
7
-
8
-
9
-
10
-
11
-
12
-
13
-
14
-
15
-
16
-
17
-
18
-
19
-
20
-
21
-
22
-
23
-
24
-
25
-
26
-
27
-
28
-
29
-
30
-
31
-
32
-
33
-
34
-
35
-
36
-
37
-
38
-
39
-
40
-
41
-
42
-
43
-
44
-
45
-
46
-
47
-
48
-
49
-
50
-
51
-
52
-
53
-
54
-
55
-
56
-
57
-
58
-
59
-
 60
60 -
 61
61 -
 62
62 -
 63
63 -
 64
64 -
 65
65 -
 66
66 -
 67
67 -
 68
68 -
 69
69 -
 70
70 -
 71
71 -
 72
72 -
 73
73 -
 74
74 -
 75
75 -
 76
76 -
 77
77 -
 78
78 -
 79
79 -
 80
80 -
81
-
82
-
83
-
84
-
85
-
86
-
87
-
88
-
89
-
90
-
91
-
92
-
93
-
94
-
95
-
96
-
97
-
98
-
99
-
100
-
101
-
102
-
103
-
104
-
105
-
106
-
107
-
108
-
109
-
110
-
111
-
112
-
113
-
114
-
115
-
116
-
117
-
118
-
119
-
120
-
121
-
122
-
123
-
124
-
125
-
126
-
127
-
128
-
129
-
130
-
131
-
132
-
133
-
134
-
135
-
136
-
137
-
138
-
139
-
140
-
141
-
142
-
143
-
144
-
145
-
146
-
147
-
148
-
149
-
150
-
151
-
152
-
153
-
154
-
155
-
156
-
157
-
158
-
159
-
160
-
161
-
162
-
163
-
164
-
165
-
166
-
167
-
168
-
169
-
170
-
171
-
172
-
173
-
174
-
175
-
176
 |
 |

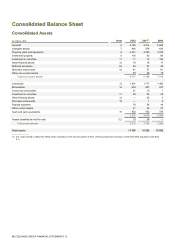
68 // DELHAIZE GROUP FINANCIAL STATEMENTS’12
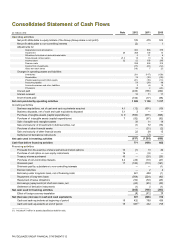
Consolidated Balance Sheet
Consolidated Assets
(in millions of €)
Note
2012
2011(1)
2010
Goodwill
6
3 189
3 414
2 828
Intangible assets
7
848
878
634
Property, plant and equipment
8
4 331
4 550
4 075
Investment property
9
116
83
60
Investment in securities
11
11
13
125
Other financial assets
12
19
18
17
Deferred tax assets
22
89
97
95
Derivative instruments
19
61
57
61
Other non-current assets
53
48
19
Total non-current assets
8 717
9 158
7 914
Inventories
13
1 401
1 717
1 460
Receivables
14
634
697
637
Income tax receivables
21
10
1
Investment in securities
11
93
93
43
Other financial assets
12
—
22
3
Derivative instruments
19
—
1
5
Prepaid expenses
79
56
44
Other current assets
41
50
37
Cash and cash equivalents
15
932
432
758
3 201
3 078
2 988
Assets classified as held for sale
5.2
18
56
—
Total current assets
3 219
3 134
2 988
Total assets
11 936
12 292
10 902
_______________
(1) 2011 was revised to reflect the effects of the completion in the second quarter of 2012 of the purchase price allocation of the Delta Maxi acquisition (see Note
4.1).