Food Lion 2012 Annual Report Download - page 39
Download and view the complete annual report
Please find page 39 of the 2012 Food Lion annual report below. You can navigate through the pages in the report by either clicking on the pages listed below, or by using the keyword search tool below to find specific information within the annual report.-
 1
1 -
2
-
3
-
4
-
5
-
6
-
7
-
8
-
9
-
10
-
11
-
12
-
13
-
14
-
15
-
16
-
17
-
18
-
19
-
20
-
21
-
22
-
23
-
24
-
25
-
26
-
27
-
28
-
 29
29 -
 30
30 -
 31
31 -
 32
32 -
 33
33 -
 34
34 -
 35
35 -
 36
36 -
 37
37 -
 38
38 -
 39
39 -
 40
40 -
 41
41 -
 42
42 -
 43
43 -
 44
44 -
 45
45 -
 46
46 -
 47
47 -
 48
48 -
 49
49 -
50
-
51
-
52
-
53
-
54
-
55
-
56
-
57
-
58
-
59
-
60
-
61
-
62
-
63
-
64
-
65
-
66
-
67
-
68
-
69
-
70
-
71
-
72
-
73
-
74
-
75
-
76
-
77
-
78
-
79
-
80
-
81
-
82
-
83
-
84
-
85
-
86
-
87
-
88
-
89
-
90
-
91
-
92
-
93
-
94
-
95
-
96
-
97
-
98
-
99
-
100
-
101
-
102
-
103
-
104
-
105
-
106
-
107
-
108
-
109
-
110
-
111
-
112
-
113
-
114
-
115
-
116
-
117
-
118
-
119
-
120
-
121
-
122
-
123
-
124
-
125
-
126
-
127
-
128
-
129
-
130
-
131
-
132
-
133
-
134
-
135
-
136
-
137
-
138
-
139
-
140
-
141
-
142
-
143
-
144
-
145
-
146
-
147
-
148
-
149
-
150
-
151
-
152
-
153
-
154
-
155
-
156
-
157
-
158
-
159
-
160
-
161
-
162
-
163
-
164
-
165
-
166
-
167
-
168
-
169
-
170
-
171
-
172
-
173
-
174
-
175
-
176
 |
 |

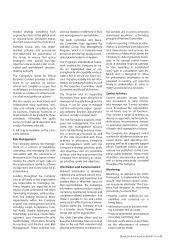
DELHAIZE GROUP ANNUAL REPORT ‘12 // 37
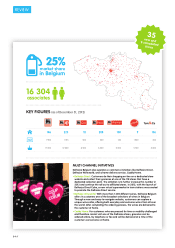
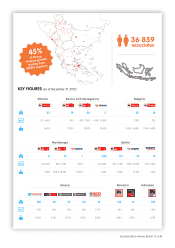
KEY FIGURES (as of December 31, 2012)
23 19 20 225 18
m2
170 - 6 000 400 400 - 2 500 4 000 - 10 000 2 200 250
16 000 12 000 19 000 25 000 15 000 - 18 000 3 000 - 6 000
Albania Bosnia and Herzegovina Bulgaria
815 1220 121 10 12
m2
up to 400 400 - 2 500 3 000 up to 400 400 - 2 500 4 000 - 10 000 500 - 2 000
4 000 12 000 - 18 000 24 000 6 600 14 500 31 500
5 000
SerbiaMontenegro
162 42 27 25 12 132 61 103
m2
1 250 440 500 220 2 370 600 260 1 000
13 300 4 150 6 750 4 250 8 200 5 900 2 000
8 700
Greece Romania Indonesia
36 859
associates
45%
of Group
revenue growth
coming from
SEE&A segment