Food Lion 2012 Annual Report Download - page 105
Download and view the complete annual report
Please find page 105 of the 2012 Food Lion annual report below. You can navigate through the pages in the report by either clicking on the pages listed below, or by using the keyword search tool below to find specific information within the annual report.-
 1
1 -
2
-
3
-
4
-
5
-
6
-
7
-
8
-
9
-
10
-
11
-
12
-
13
-
14
-
15
-
16
-
17
-
18
-
19
-
20
-
21
-
22
-
23
-
24
-
25
-
26
-
27
-
28
-
29
-
30
-
31
-
32
-
33
-
34
-
35
-
36
-
37
-
38
-
39
-
40
-
41
-
42
-
43
-
44
-
45
-
46
-
47
-
48
-
49
-
50
-
51
-
52
-
53
-
54
-
55
-
56
-
57
-
58
-
59
-
60
-
61
-
62
-
63
-
64
-
65
-
66
-
67
-
68
-
69
-
70
-
71
-
72
-
73
-
74
-
75
-
76
-
77
-
78
-
79
-
80
-
81
-
82
-
83
-
84
-
85
-
86
-
87
-
88
-
89
-
90
-
91
-
92
-
93
-
94
-
 95
95 -
 96
96 -
 97
97 -
 98
98 -
 99
99 -
 100
100 -
 101
101 -
 102
102 -
 103
103 -
 104
104 -
 105
105 -
 106
106 -
 107
107 -
 108
108 -
 109
109 -
 110
110 -
 111
111 -
 112
112 -
 113
113 -
 114
114 -
 115
115 -
116
-
117
-
118
-
119
-
120
-
121
-
122
-
123
-
124
-
125
-
126
-
127
-
128
-
129
-
130
-
131
-
132
-
133
-
134
-
135
-
136
-
137
-
138
-
139
-
140
-
141
-
142
-
143
-
144
-
145
-
146
-
147
-
148
-
149
-
150
-
151
-
152
-
153
-
154
-
155
-
156
-
157
-
158
-
159
-
160
-
161
-
162
-
163
-
164
-
165
-
166
-
167
-
168
-
169
-
170
-
171
-
172
-
173
-
174
-
175
-
176
 |
 |

DELHAIZE GROUP FINANCIAL STATEMENTS ’12 // 103
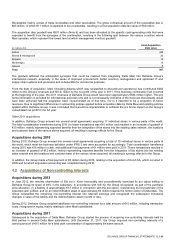
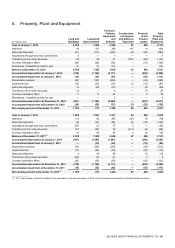
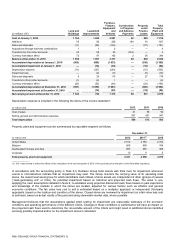
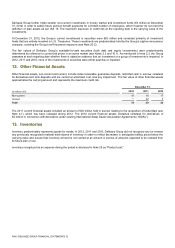
Impairment losses of property, plant and equipment are recorded in other operating expenses (Note 28).
During the fourth quarter of 2012, the Group recognized impairment charges of €87 million related to (i) 45 stores (34 Sweetbay,
8 Food Lion and 3 Bottom Dollar Food) that were closed early 2013 and 9 underperforming stores, both in the United States, for
a total amount of €54 million, (ii) the closing of 6 stores and underperformance of 57 stores in Southeastern Europe (€28 million),
and (iii) 1 store closing and the impairment of 6 stores in Belgium (€5 million).
A store portfolio review resulted in the decision to close 146 underperforming stores in the first quarter of 2012. Consequently,
the Group recorded in 2011 €115 million impairment charges relating to 126 stores in the U.S. (113 Food Lion, 7 Bloom and 6
Bottom Dollar stores) and one distribution center, while the underperformance of 20 Maxi stores (in Serbia, Bulgaria and Bosnia
and Herzegovina) was already reflected in the fair values of the related assets in the opening balance sheet (see Note 4). In
addition, Delhaize Group recognized impairment reversals of €3 million in the United States, which was offset by impairment
charges in various other parts of the Group.
The 2010 impairment losses of €12 million relate to underperforming stores, mainly in the United States, with only insignificant
amounts incurred in connection with store closings.
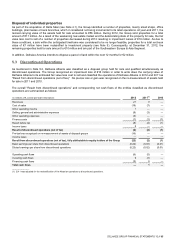
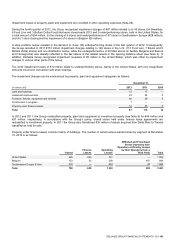
The impairment charges can be summarized by property, plant and equipment categories as follows:
(in millions of €)
December 31,
2012
2011
2010
Land and buildings
15
17
—
Leasehold improvements
23
24
2
Furniture, fixtures, equipment and vehicles
36
39
5
Construction in progress
1
—
—
Property under finance leases
12
35
5
Total
87
115
12
In 2012 and 2011, the Group reclassified property, plant and equipment to investment property (see Note 9) for €44 million and
€31 million, respectively. In accordance with the Group’s policy, closed stores held under finance lease agreements are
reclassified to investment property. In 2011 the Group also transferred €16 million of assets acquired from Delta Maxi to “Assets
classified as held for sale.”
Property under finance leases consists mainly of buildings. The number of owned versus leased stores by segment at December
31, 2012 is as follows:
Owned
Finance
Leases
Operating
Leases
Affiliated and Franchised
Stores Owned by their
Operators or Directly Leased
by their Operators from a
Third Party
Total
United States
229
593
731
—
1 553
Belgium
153
32
208
447
840
Southeastern Europe & Asia
318
—
694
46
1 058
Total
700
625
1 633
493
3 451