Food Lion 2012 Annual Report Download - page 161
Download and view the complete annual report
Please find page 161 of the 2012 Food Lion annual report below. You can navigate through the pages in the report by either clicking on the pages listed below, or by using the keyword search tool below to find specific information within the annual report.-
 1
1 -
2
-
3
-
4
-
5
-
6
-
7
-
8
-
9
-
10
-
11
-
12
-
13
-
14
-
15
-
16
-
17
-
18
-
19
-
20
-
21
-
22
-
23
-
24
-
25
-
26
-
27
-
28
-
29
-
30
-
31
-
32
-
33
-
34
-
35
-
36
-
37
-
38
-
39
-
40
-
41
-
42
-
43
-
44
-
45
-
46
-
47
-
48
-
49
-
50
-
51
-
52
-
53
-
54
-
55
-
56
-
57
-
58
-
59
-
60
-
61
-
62
-
63
-
64
-
65
-
66
-
67
-
68
-
69
-
70
-
71
-
72
-
73
-
74
-
75
-
76
-
77
-
78
-
79
-
80
-
81
-
82
-
83
-
84
-
85
-
86
-
87
-
88
-
89
-
90
-
91
-
92
-
93
-
94
-
95
-
96
-
97
-
98
-
99
-
100
-
101
-
102
-
103
-
104
-
105
-
106
-
107
-
108
-
109
-
110
-
111
-
112
-
113
-
114
-
115
-
116
-
117
-
118
-
119
-
120
-
121
-
122
-
123
-
124
-
125
-
126
-
127
-
128
-
129
-
130
-
131
-
132
-
133
-
134
-
135
-
136
-
137
-
138
-
139
-
140
-
141
-
142
-
143
-
144
-
145
-
146
-
147
-
148
-
149
-
150
-
 151
151 -
 152
152 -
 153
153 -
 154
154 -
 155
155 -
 156
156 -
 157
157 -
 158
158 -
 159
159 -
 160
160 -
 161
161 -
 162
162 -
 163
163 -
 164
164 -
 165
165 -
 166
166 -
 167
167 -
 168
168 -
 169
169 -
 170
170 -
 171
171 -
172
-
173
-
174
-
175
-
176
 |
 |

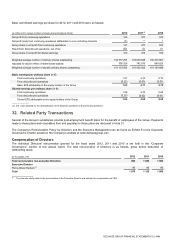
DELHAIZE GROUP FINANCIAL STATEMENTS ’12 // 159
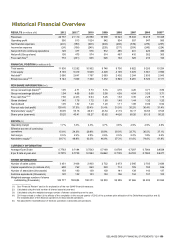
Historical Financial Overview
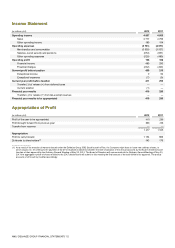
RESULTS (in millions of €)
2012
2011(4)
2010
2009
2008
2007
2006
2005(5)
Revenues
22 737
21 110
20 850
19 938
19 024
18 943
19 215
18 345
Operating profit
390
813
1 024
942
904
937
947
900
Net financial expenses
(241)
(180)
(203)
(202)
(202)
(332)
(276)
(297)
Income tax expense
(24)
(156)
(245)
(228)
(217)
(204)
(245)
(224)
Net profit from continuing operations
125
477
576
512
485
401
426
380
Net profit (Group share)
105
475
574
514
467
410
352
365
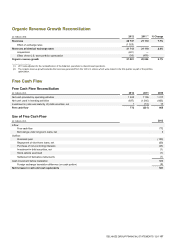
Free cash flow(1)
772
(231)
665
626
162
326
216
164
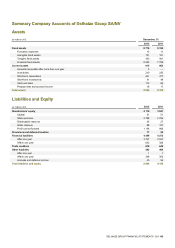
FINANCIAL POSITION (in millions of €)
Total assets
11 936
12 292
10 902
9 748
9 700
8 822
9 295
10 254
Total equity
5 193
5 419
5 069
4 409
4 195
3 676
3 561
3 596
Net debt(1)
2 060
2 647
1 787
2 063
2 402
2 244
2 635
2 943
Enterprise value(1),(2)
5 144
7 069
7 400
7 472
6 849
8 281
8 726
8 171
PER SHARE INFORMATION (in €)
Group net earnings (basic)(3)
1.05
4.71
5.73
5.16
4.70
4.20
3.71
3.89
Group net earnings (diluted)(3)
1.04
4.68
5.68
5.08
4.59
4.04
3.55
3.71
Free cash flow(1),(4)
7.66
(2.29)
6.64
6.26
1.63
3.35
2.28
1.75
Gross dividend
1.40
1.76
1.72
1.60
1.48
1.44
1.32
1.20
Net dividend
1.05
1.32
1.29
1.20
1.11
1.08
0.99
0.90
Pay-out ratio (net profit)
135.4%
37.8%
30.4%
31.4%
31.9%
35.2%
36.4%
31.4%
Shareholders’ equity(2)
50.95
53.18
49.91
43.54
41.19
36.17
36.55
37.65
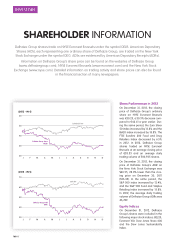
Share price (year-end)
30.25
43.41
55.27
53.62
44.20
60.20
63.15
55.20
RATIOS (%)
Operating margin
1.7%
3.9%
4.9%
4.7%
4.8%
4.9%
4.9%
4.9%
Effective tax rate of continuing
operations
15.8%
24.6%
29.8%
30.8%
30.9%
33.7%
36.5%
37.1%
Net margin
0.5%
2.2%
2.8%
2.6%
2.5%
2.2%
1.8%
2.0%
Net debt to equity(1)
39.7%
48.8%
35.3%
46.8%
57.3%
61.0%
74.0%
81.8%
CURRENCY INFORMATION
Average € per $ rate
0.7783
0.7184
0.7543
0.7169
0.6799
0.7297
0.7964
0.8038
€ per $ rate at year-end
0.7579
0.7729
0.7484
0.6942
0.7185
0.6793
0.7593
0.8477
OTHER INFORMATION
Number of sales outlets
3 451
3 408
2 800
2 732
2 673
2 545
2 705
2 636
Capital expenditures (in millions of €)
688
762
660
520
714
729
700
636
Number of associates (thousands)
158
160
139
138
141
138
143
137
Full-time equivalents (thousands)
120
122
103
104
106
104
107
102
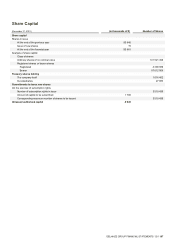
Weighted average number of shares
outstanding (thousands)
100 777
100 684
100 271
99 803
99 385
97 666
94 939
93 934
_____________
(1) See “Financial Review” section for explanation of the non-GAAP financial measures.
(2) Calculated using the total number of shares issued at year-end.
(3) Calculated using the weighted average number of shares outstanding over the year.
(4) 2011 was revised to reflect (i) the effects of the completion in the second quarter of 2012 of the purchase price allocation of the Delta Maxi acquisition and (ii)
the reclassification of the Albanian operations to discontinued operations.
(5) Not adjusted for reclassification of German operations to discontinued operations.