Food Lion 2012 Annual Report Download - page 111
Download and view the complete annual report
Please find page 111 of the 2012 Food Lion annual report below. You can navigate through the pages in the report by either clicking on the pages listed below, or by using the keyword search tool below to find specific information within the annual report.-
 1
1 -
2
-
3
-
4
-
5
-
6
-
7
-
8
-
9
-
10
-
11
-
12
-
13
-
14
-
15
-
16
-
17
-
18
-
19
-
20
-
21
-
22
-
23
-
24
-
25
-
26
-
27
-
28
-
29
-
30
-
31
-
32
-
33
-
34
-
35
-
36
-
37
-
38
-
39
-
40
-
41
-
42
-
43
-
44
-
45
-
46
-
47
-
48
-
49
-
50
-
51
-
52
-
53
-
54
-
55
-
56
-
57
-
58
-
59
-
60
-
61
-
62
-
63
-
64
-
65
-
66
-
67
-
68
-
69
-
70
-
71
-
72
-
73
-
74
-
75
-
76
-
77
-
78
-
79
-
80
-
81
-
82
-
83
-
84
-
85
-
86
-
87
-
88
-
89
-
90
-
91
-
92
-
93
-
94
-
95
-
96
-
97
-
98
-
99
-
100
-
 101
101 -
 102
102 -
 103
103 -
 104
104 -
 105
105 -
 106
106 -
 107
107 -
 108
108 -
 109
109 -
 110
110 -
 111
111 -
 112
112 -
 113
113 -
 114
114 -
 115
115 -
 116
116 -
 117
117 -
 118
118 -
 119
119 -
 120
120 -
 121
121 -
122
-
123
-
124
-
125
-
126
-
127
-
128
-
129
-
130
-
131
-
132
-
133
-
134
-
135
-
136
-
137
-
138
-
139
-
140
-
141
-
142
-
143
-
144
-
145
-
146
-
147
-
148
-
149
-
150
-
151
-
152
-
153
-
154
-
155
-
156
-
157
-
158
-
159
-
160
-
161
-
162
-
163
-
164
-
165
-
166
-
167
-
168
-
169
-
170
-
171
-
172
-
173
-
174
-
175
-
176
 |
 |

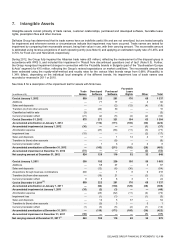
DELHAIZE GROUP FINANCIAL STATEMENTS ’12 // 109
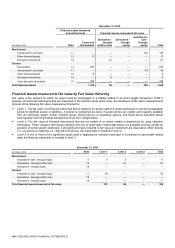
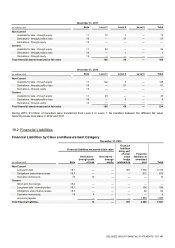
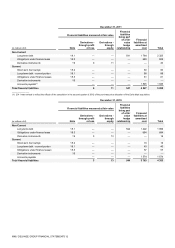
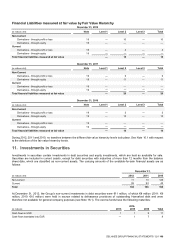
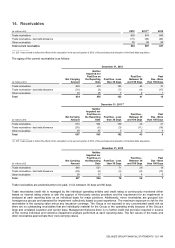
Financial Liabilities measured at fair value by Fair Value Hierarchy
December 31, 2012
(in millions of €)
Note
Level 1
Level 2
Level 3
Total
Non-Current
Derivatives - through profit or loss
19
—
10
—
10
Derivatives - through equity
19
—
—
—
—
Current
Derivatives - through profit or loss
19
—
4
—
4
Derivatives - through equity
19
—
—
—
—
Total financial liabilities measured at fair value
—
14
—
14
December 31, 2011
(in millions of €)
Note
Level 1
Level 2
Level 3
Total
Non-Current
Derivatives - through profit or loss
19
—
9
—
9
Derivatives - through equity
19
—
11
—
11
Current
Derivatives - through profit or loss
19
—
—
—
—
Derivatives - through equity
19
—
—
—
—
Total financial liabilities measured at fair value
—
20
—
20
December 31, 2010
(in millions of €)
Note
Level 1
Level 2
Level 3
Total
Non-Current
Derivatives - through profit or loss
19
—
3
—
3
Derivatives - through equity
19
—
13
—
13
Current
Derivatives - through profit or loss
19
—
—
—
—
Derivatives - through equity
19
—
—
—
—
Total financial liabilities measured at fair value
—
16
—
16
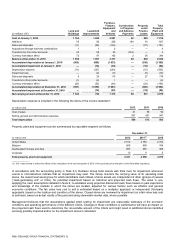
During 2012, 2011 and 2010, no transfers between the different fair value hierarchy levels took place. See Note 10.1 with respect
to the definition of the fair value hierarchy levels.
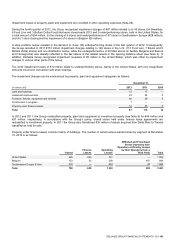
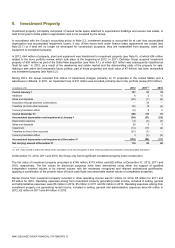
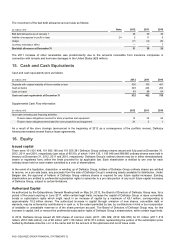
11. Investments in Securities
Investments in securities contain investments in debt securities and equity investments, which are held as available for sale.
Securities are included in current assets, except for debt securities with maturities of more than 12 months from the balance
sheet date, which are classified as non-current assets. The carrying amounts of the available-for-sale financial assets are as
follows:
December 31,
(in millions of €)
2012
2011
2010
Non-current
11
13
125
Current
93
93
43
Total
104
106
168
At December 31, 2012, the Group’s non-current investments in debt securities were €11 million, of which €8 million (2011: €9
million, 2010: €10 million) were held in escrow related to defeasance provisions of outstanding Hannaford debt and were
therefore not available for general company purposes (see Note 18.1). The escrow funds have the following maturities:
(in millions)
2013
2014-
2015
2016
Total
Cash flows in USD
1
1
9
11
Cash flows translated into EUR
—
1
7
8