Food Lion 2012 Annual Report Download - page 55
Download and view the complete annual report
Please find page 55 of the 2012 Food Lion annual report below. You can navigate through the pages in the report by either clicking on the pages listed below, or by using the keyword search tool below to find specific information within the annual report.-
 1
1 -
2
-
3
-
4
-
5
-
6
-
7
-
8
-
9
-
10
-
11
-
12
-
13
-
14
-
15
-
16
-
17
-
18
-
19
-
20
-
21
-
22
-
23
-
24
-
25
-
26
-
27
-
28
-
29
-
30
-
31
-
32
-
33
-
34
-
35
-
36
-
37
-
38
-
39
-
40
-
41
-
42
-
43
-
44
-
 45
45 -
 46
46 -
 47
47 -
 48
48 -
 49
49 -
 50
50 -
 51
51 -
 52
52 -
 53
53 -
 54
54 -
 55
55 -
 56
56 -
 57
57 -
 58
58 -
 59
59 -
 60
60 -
 61
61 -
 62
62 -
 63
63 -
 64
64 -
 65
65 -
66
-
67
-
68
-
69
-
70
-
71
-
72
-
73
-
74
-
75
-
76
-
77
-
78
-
79
-
80
-
81
-
82
-
83
-
84
-
85
-
86
-
87
-
88
-
89
-
90
-
91
-
92
-
93
-
94
-
95
-
96
-
97
-
98
-
99
-
100
-
101
-
102
-
103
-
104
-
105
-
106
-
107
-
108
-
109
-
110
-
111
-
112
-
113
-
114
-
115
-
116
-
117
-
118
-
119
-
120
-
121
-
122
-
123
-
124
-
125
-
126
-
127
-
128
-
129
-
130
-
131
-
132
-
133
-
134
-
135
-
136
-
137
-
138
-
139
-
140
-
141
-
142
-
143
-
144
-
145
-
146
-
147
-
148
-
149
-
150
-
151
-
152
-
153
-
154
-
155
-
156
-
157
-
158
-
159
-
160
-
161
-
162
-
163
-
164
-
165
-
166
-
167
-
168
-
169
-
170
-
171
-
172
-
173
-
174
-
175
-
176
 |
 |

DELHAIZE GROUP ANNUAL REPORT ‘12 // 53
In 2012, the CEO and the mem-
bers of the Executive Management
received payment of their annual
bonus related to their performance
during 2011.
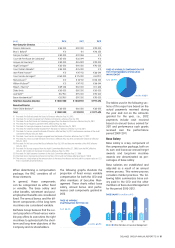
The table below shows an overview of
the Annual Bonus amounts paid dur-
ing 2012, 2011 and 2010 (based on the
performance of the previous year).
Annual
Bonus(1) CEO Other Members
of Executive
Management
(in millions of €)Payout Number of
persons Payout
2010 0.68 7 1.63
2011 0.66 6 1.29
2012 0.39 8 1.01
2013 0.39 61.04
(1) Amounts are gross before deduction of withholding
taxes and social security levy.
Performance during 2012
With respect to annual bonuses
paid in 2013 based on performance
in 2012, the annual bonus for the
members of management having
the level of Director, Vice President,
Senior Vice President, Executive Vice
President and CEO is funded based
on the following elements:
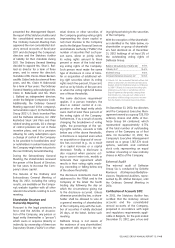
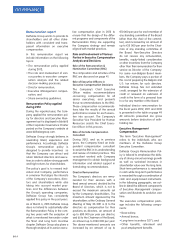
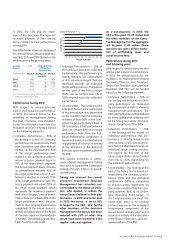
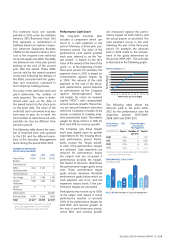
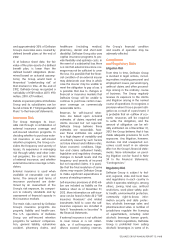
•Company Performance – 50% of
the funding is based on Company
performance as measured by Profit
from Operations and other relevant
metrics. For the 2012 payment, 90%
of the target performance level
needed to be achieved in order to
receive a bonus payment equal to
75% of the target bonus payment.
The bonus payment levels increase
as performance exceeds 90% of
the target performance level. If per-
formance reaches or exceeds 110%
of the target performance level, the
bonus payment will equal 125% of
the target bonus payment, which
represents the maximum payment
level. If the Company’s actual perfor-
mance does not achieve 90% of the
target performance level, the pay-
ment of the Company Performance
component of the annual bonus is
entirely at the discretion of the Board
of Directors upon recommendation
of the RNC. The following graph illus-
trates how this scale works.
BONUS PAYOUT (in %)
Funding Percent
Percent to Budget
140
120
100
80
60
40
20
0
50 60 70 80 90 100 110 120 130 140 150
• Individual Performance – 50% of
the funding is based on individual
performance: this performance is
directly linked to the achievement
of 4-5 individual targets that are
identified through an individual
target setting process. The payout
for this part of the bonus target
(50%) can be funded from 0% to
150% depending on the individual
performance.
•
Circuit breaker – The funding for the
Individual Performance component
of the annual bonus is dependent
on the condition that the Company
achieves at least 80% of the Com-
pany’s target performance level. If
the Company’s actual performance
does not achieve 80% of its target
performance level then the Indi-
vidual Performance component of
the annual bonus is not funded and
any payment of a bonus is entirely
at the discretion of the Board of
Directors upon recommendation of
the RNC.
This system enhances a perfor-
mance-based management culture
that aims to support the Company’s
strategy through a focus on growth
and efficiency.
Taking into account the current
economic environment Executive
Management has voluntary rec-
ommended to the Board of Direc-
tors, who agreed, to reduce the
Annual bonus related to their per-
formance in 2012 and to be paid
in 2013: the bonus is set at 50%
of target for the CEO, and for the
other members of the Executive
Management the bonus has been
reduced with 20% of what they
would have been entitled to if the
regular scale was applied.
As a consequence, in 2013, the
CEO will be paid
€
0.39 million and
the other members of the Execu-
tive Management in the aggregate
will be paid
€
1.04 million (these
amounts are gross before deduc-
tion of withholding taxes and
social security levy).
Performance during 2013
and following years
With respect to annual bonuses that
will be paid based on performance
in 2013 the annual bonus for the
members of management having
the level of Director, Vice President,
Senior Vice President, Executive Vice
President and CEO will be funded
based on the following elements:
•
Company Performance – 50% of
the funding will be based on Com-
pany performance as measured
by achievement of both Underlying
Operating Profit and Revenue. The
2013 payment scales will be defined
for every operational company and
for the Group as a whole. The fund-
ing can range from 0% to 150%.
• Individual Performance – 50%
of the funding will be based on
individual performance: this per-
formance is directly linked to the
achievement of 4-5 individual tar-
gets that are identified through an
individual target setting process.
The payout for this part of the
bonus target (50%) can be funded
from 0% to 150% depending on
the individual performance.
• Circuit breaker –
The funding of the
part of the bonus that is based on,
respectively, the Company perfor-
mance (50%) and the individual
performance (50%) is, compared
to previous years, dependent on
the stricter condition that the Com-
pany achieves 90% of its Under-
lying Operating Profit target. If
the Company does not meet this
target then there is no funding
of the Company or the Individual
Performance components of the
annual bonus and any payment of
a bonus is entirely at the discretion
of the Board of Directors upon rec-
ommendation of the RNC.