Family Dollar 2003 Annual Report Download - page 21
Download and view the complete annual report
Please find page 21 of the 2003 Family Dollar annual report below. You can navigate through the pages in the report by either clicking on the pages listed below, or by using the keyword search tool below to find specific information within the annual report.
17
Income Taxes
The effective tax rate was 36.5% in fiscal 2003, fiscal 2002, and fiscal 2001. For fiscal
2004, the Company’s plan is for the effective tax rate to remain at approximately the
same level as the rate in fiscal 2003.
Liquidity and Capital Resources
The Company has consistently maintained a strong liquidity position. Cash provided
by operating activities during fiscal 2003 was $295.0 million as compared to $402.6
million in fiscal 2002 and $165.9 million in fiscal 2001. These amounts have enabled
the Company to fund its regular operating needs, capital expenditure program, cash
dividend payments and any repurchase of the Company’s Common Stock. In addition,
the Company maintains $200 million of unsecured revolving credit facilities with banks
for short-term financing of seasonal cash needs. One hundred million dollars of the
facilities expires on May 27, 2004 and the remaining $100 million expires on May 31,
2005. The Company had no borrowings against these facilities during fiscal 2003.
There were no long-term borrowings during fiscal 2003, 2002 or 2001.
Merchandise inventories at August 30, 2003 increased 11.4% over the level at August 31,
2002. This increase was due to additional inventory for 411 net new stores, early receipt
of certain seasonal merchandise, and a buildup to support a transition in the merchan-
dise assortments of the home departments (domestics, houseware and giftware). This
was partially offset by improved inventory turnover due to supply chain initiatives.
The increase in capital expenditures to $219.8 million in fiscal 2003 from $186.7 mil-
lion in fiscal 2002 primarily was due to expenditures incurred in fiscal 2003 to com-
plete construction of the seventh distribution center and costs incurred to purchase a
greater number of owned stores. Capital expenditures for fiscal 2004 are expected to
be approximately $275 million, which primarily represent estimated expenditures for
new store expansion, including construction of an increased number of stores, existing
store expansion, relocation, and renovation, the construction of the eighth distribution
center and expenditures related to store-focused technology infrastructure. The new
store expansion and eighth distribution center will also require additional investment
in merchandise inventories.
Capital spending plans, including store expansion, are continuously reviewed and are
subject to change. Cash flow from current operations is expected to be sufficient to
meet planned liquidity and capital resource needs, including store expansion and other
capital spending programs and any repurchase of the Company’s Common Stock. In
addition, the Company has available revolving credit facilities as discussed above.
On October 9, 2002, the Board of Directors authorized the purchase of up to 5 million
shares of its outstanding Common Stock from time to time as market conditions
warrant. The Company purchased in the open market 2.2 million shares at a cost
of $65.9 million in fiscal 2003.
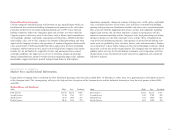
The following table shows the Company’s obligations and commitments as of August 30,
2003, to make future payments under contractual obligations (In thousands):
Payments Due During One Year Fiscal Period Ending
Contractual August August August August August There-
Obligations Total 2004 2005 2006 2007 2008 after
Merchandise letters
of credit $ 56,430 $ 56,430 $ — $ — $ — $ — $ —
Operating leases 796,565 190,840 167,434 136,444 102,997 67,204 131,646
Construction
obligations 17,044 17,044 — — — — —
Total Contractual
Cash Obligations $870,039 $264,314 $167,434 $136,444 $102,997 $67,204 $131,646
The following table shows the Company’s other commercial commitments as of
August 30, 2003 (In thousands):
Other Commercial Commitments Total Amounts Committed
Standby letters of credit $50,600
Surety bonds 6,018
Total Commercial Commitments $56,618
At August 30, 2003, approximately $41.2 million of the merchandise letters of credit
are included in accounts payable on the Company’s balance sheet. A substantial por-
tion of the outstanding amount of standby letters of credit and surety bonds (which
are primarily renewed on an annual basis) are used as surety for future premium and
deductible payments to the Company’s workers’ compensation and general liability
insurance carrier. The Company accrues for these liabilities as described in the
“Critical Accounting Policies” section of this discussion.


