Family Dollar 2003 Annual Report Download - page 18
Download and view the complete annual report
Please find page 18 of the 2003 Family Dollar annual report below. You can navigate through the pages in the report by either clicking on the pages listed below, or by using the keyword search tool below to find specific information within the annual report.-
 1
1 -
2
-
3
-
4
-
5
-
6
-
7
-
 8
8 -
 9
9 -
 10
10 -
 11
11 -
 12
12 -
 13
13 -
 14
14 -
 15
15 -
 16
16 -
 17
17 -
 18
18 -
 19
19 -
 20
20 -
 21
21 -
 22
22 -
 23
23 -
 24
24 -
 25
25 -
 26
26 -
 27
27 -
 28
28 -
29
-
30
-
31
-
32
-
33
-
34
-
35
-
36
-
37
-
38
 |
 |

14
Family Dollar Stores, Inc. and Subsidiaries
Management’s Discussion and Analysis of
Financial Condition and Results of Operations
This discussion summarizes the significant factors affecting the consolidated results
of operations and financial condition of the Company for the fiscal years ended
August 30, 2003 and August 31, 2002. This discussion should be read in conjunction
with the Consolidated Financial Statements and Notes to Consolidated Financial
Statements included in this Annual Report.
Net Sales
Net sales increased approximately 14.1% ($587.5 million) in fiscal 2003 compared
with fiscal 2002, and approximately 13.6% ($497.3 million) in fiscal 2002 compared
with fiscal 2001. The calendar followed by the Company and most retailers included
a non-comparative fifth week in January 2001 resulting in there being 53 weeks in
fiscal 2001. Sales for this week were approximately $66.5 million. The increases in
fiscal 2003 and fiscal 2002 were attributable to increased sales in existing stores (stores
open more than 13 months) and sales from new stores opened as part of the Company’s
store expansion program.
Sales in existing stores increased approximately 3.8% in fiscal 2003 and 5.8% in fiscal
2002, as compared with the respective prior years, as customers continued to respond
favorably to the Company’s everyday low pricing strategy and shift in the merchan-
dise mix toward more basic consumable hardlines merchandise. In fiscal 2003, the
customer count, as measured by the number of register transactions in existing stores,
increased approximately 1.9%, and the average transaction increased approximately
1.6% to $8.87. Increased sales of hardlines merchandise have been the primary con-
tributor to the overall sales increases, with hardlines sales increases in existing stores
of approximately 4.3% in fiscal 2003. Hardlines as a percentage of total sales increased
to 76.7% in fiscal 2003 compared to 76.4% in fiscal 2002. Softlines as a percentage of
sales decreased to 23.3% in fiscal 2003 (with hanging apparel and shoes representing
12.4%, basic apparel 4.4% and domestics 6.5%) compared to 23.6% in fiscal 2002
(with hanging apparel and shoes representing 12.4%, basic apparel 4.5% and domes-
tics 6.7%). By the end of the second quarter of fiscal 2003, all stores had anniver-
saried the fiscal 2002 program in which the Company eliminated approximately
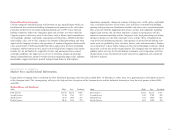
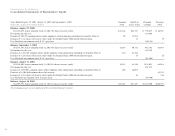
Summary of Selected Financial Data
August 30, August 31, September 1, August 26, August 28,
Years Ended (In thousands, except per share amounts and store data) 2003 2002 2001 2000 1999
Net sales $4,750,171 $4,162,652 $3,665,362 $3,132,639 $2,751,181
Cost of sales and operating expenses 4,360,446 3,821,031 3,366,940 2,861,728 2,528,502
Income before income taxes and cumulative effect of accounting change 389,725 341,621 298,422 270,911 222,679
Income taxes 142,250 124,692 108,917 98,894 82,600
Income before cumulative effect of accounting change 247,475 216,929 189,505 172,017 140,079
Cumulative effect of change in method of accounting for income taxes —————
Net income 247,475 216,929 189,505 172,017 140,079
Earnings per common share:
Income before cumulative effect of accounting change(1) $1.43 $1.25 $1.10 $ 1.00 $ .81
Net income(1) $1.43 $1.25 $1.10 $ 1.00 $ .81
Dividends declared $49,890 $44,106 $ 40,352 $ 36,858 $ 33,657
Dividends declared per common share $.29$.25
1⁄2$.23
1⁄2$.21
1⁄2$.19
1⁄2
Total assets $1,985,695 $1,754,619 $1,399,745 $1,243,714 $1,095,252
Working capital $561,161 $525,079 $ 416,971 $ 338,655 $ 341,408
Shareholders’ equity $1,310,969 $1,154,948 $ 959,015 $ 797,964 $ 690,650
Stores opened 475 525 502 406 366
Stores closed (64) (50) (50) (41) (59)
Number of stores—end of year 5,027 4,616 4,141 3,689 3,324
(1) Figures represent diluted earnings per common share.