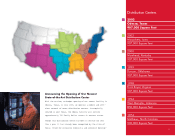
Family Dollar 2003 Annual Report Download - page 19
Download and view the complete annual report
Please find page 19 of the 2003 Family Dollar annual report below. You can navigate through the pages in the report by either clicking on the pages listed below, or by using the keyword search tool below to find specific information within the annual report.-
 1
1 -
2
-
3
-
4
-
5
-
6
-
7
-
8
-
 9
9 -
 10
10 -
 11
11 -
 12
12 -
 13
13 -
 14
14 -
 15
15 -
 16
16 -
 17
17 -
 18
18 -
 19
19 -
 20
20 -
 21
21 -
 22
22 -
 23
23 -
 24
24 -
 25
25 -
 26
26 -
 27
27 -
 28
28 -
 29
29 -
30
-
31
-
32
-
33
-
34
-
35
-
36
-
37
-
38
 |
 |
15
one-half of the shoe inventories. Therefore, the sales of hardlines and softlines is now
on a more comparative basis year over year. Notwithstanding this change, softline
sales in existing stores increased approximately 2.1% in fiscal 2003. For fiscal 2004,
the Company’s plan is for sales in existing stores to increase in the 4% to 6% range.
The Company reduced the number of advertising circulars distributed in fiscal 2003
to one, which was one less than was distributed in fiscal 2002. The adverse sales impact
of discontinuing one circular was offset by the increased customer traffic generated
by the everyday low pricing strategy and shift in the merchandise mix. For fiscal 2004,
the Company plans to distribute one circular.
The existing store sales increase of approximately 5.8% in fiscal 2002 was also pri-
marily attributable to the favorable customer response to everyday low pricing and
increased sales of hardlines. In fiscal 2002, the average transaction increased approxi-
mately 1.9% to $8.75 and the customer count increased approximately 3.8%. In fiscal
2002, existing store hardlines sales increased approximately 8.4% and softlines sales
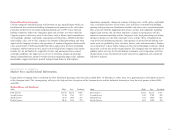
August 29, August 31, August 31, August 31, August 31,
1998 1997 1996 1995 1994
$2,361,930 $1,994,973 $1,714,627 $1,546,895 $1,428,440
2,195,942 1,873,496 1,615,861 1,452,519 1,328,323
165,988 121,477 98,766 94,376 100,117
62,700 46,800 38,178 36,266 38,157
103,288 74,677 60,588 58,110 61,960
——— —1,139
103,288 74,677 60,588 58,110 63,099
$.60 $.44 $.35 $ .34 $ .36
$.60 $.44 $.35 $ .34 $ .37
$30,116 $ 26,849 $ 24,435 $ 21,837 $ 18,656
$.17
1⁄2$.15
2⁄3$.14
1⁄3$.12
2⁄3$.11
$942,180 $ 780,294 $ 696,808 $ 636,234 $ 592,822
$303,354 $ 283,476 $ 273,694 $ 264,672 $ 230,235
$578,150 $ 500,198 $ 444,957 $ 407,751 $ 370,172
315 236 223 213 202
(65) (50) (58) (12) (22)
3,017 2,767 2,581 2,416 2,215
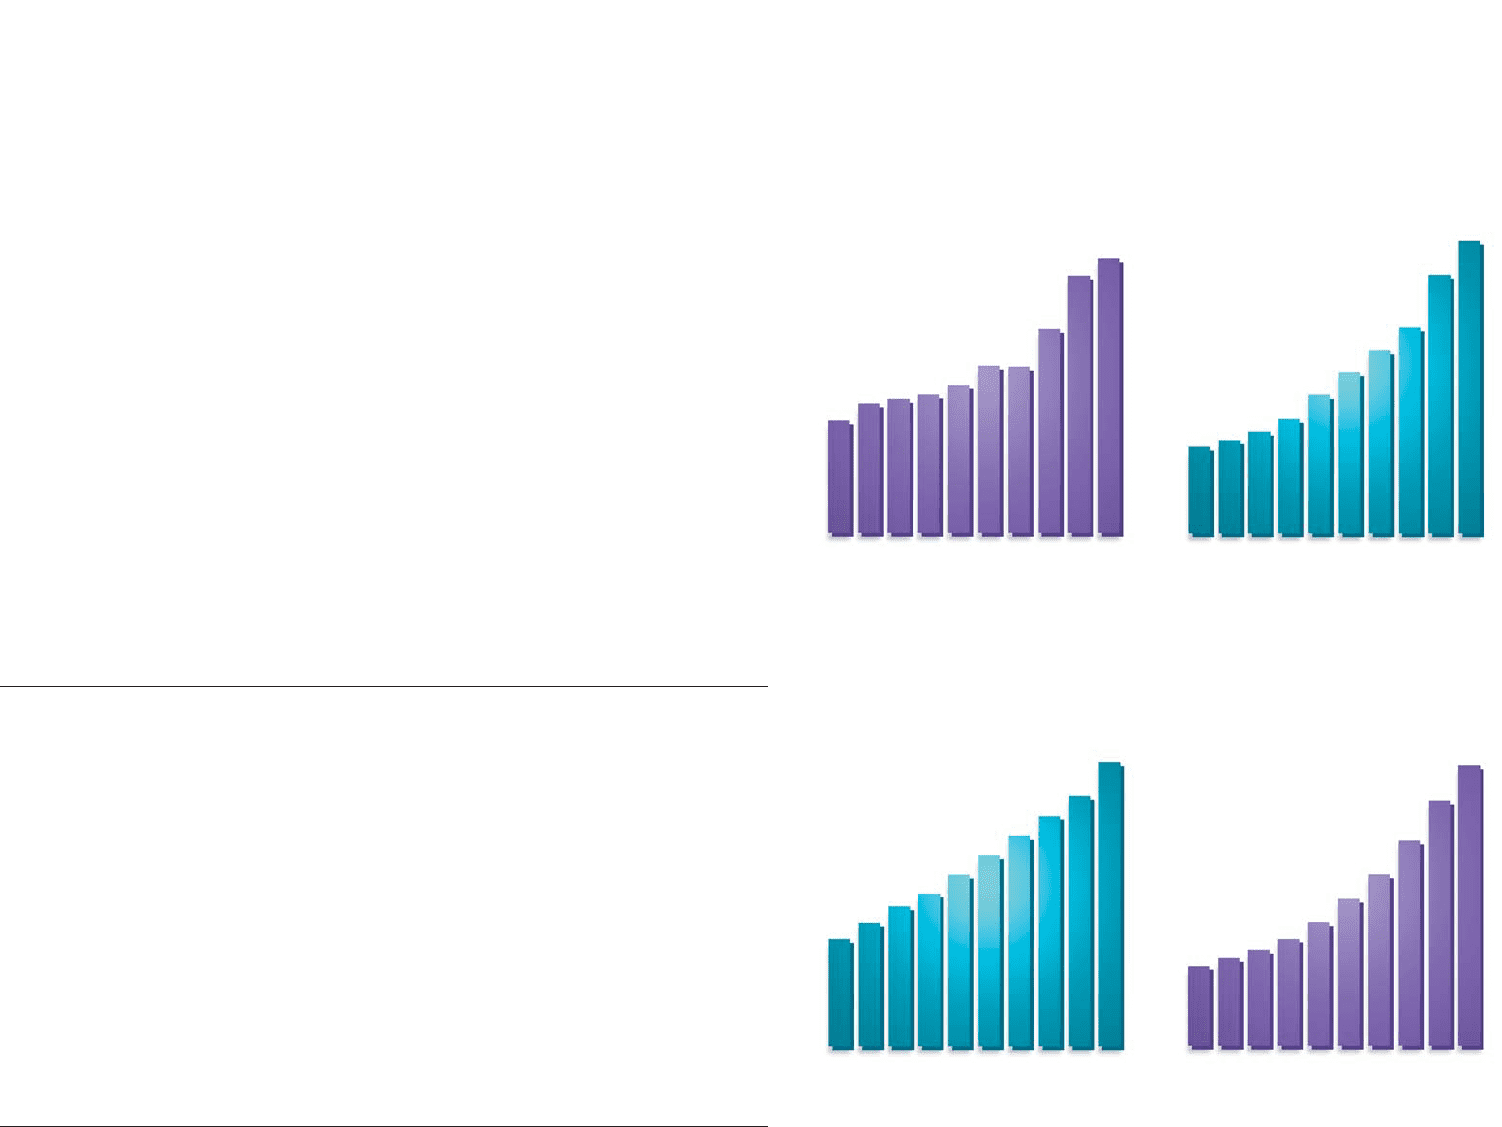
230
265 274 283
303
341 339
417
525
561
’94 ’95 ’96 ’97 ’98 ’99 ’00 ’01 ’02 ’03
Working Capital
(millions of dollars)
593 636 697
780
942
1,095
1,244
1,400
1,755
1,986
’94 ’95 ’96 ’97 ’98 ’99 ’00 ’01 ’02 ’03
Total Assets
(millions of dollars)
.11
.122⁄3
.141⁄3
.152⁄3
.171⁄2
.191⁄2
.211⁄2
.231⁄2
.251⁄2
.29
’94 ’95 ’96 ’97 ’98 ’99 ’00 ’01 ’02 ’03
Dividends Declared
Per Common Share
(dollars)
2.18 2.40 2.61
2.92
3.36
4.00
4.66
5.57
6.66
7.61
’94 ’95 ’96 ’97 ’98 ’99 ’00 ’01 ’02 ’03
Book Value Per Common Share
(dollars)