Family Dollar 2003 Annual Report Download - page 20
Download and view the complete annual report
Please find page 20 of the 2003 Family Dollar annual report below. You can navigate through the pages in the report by either clicking on the pages listed below, or by using the keyword search tool below to find specific information within the annual report.-
 1
1 -
2
-
3
-
4
-
5
-
6
-
7
-
8
-
9
-
 10
10 -
 11
11 -
 12
12 -
 13
13 -
 14
14 -
 15
15 -
 16
16 -
 17
17 -
 18
18 -
 19
19 -
 20
20 -
 21
21 -
 22
22 -
 23
23 -
 24
24 -
 25
25 -
 26
26 -
 27
27 -
 28
28 -
 29
29 -
 30
30 -
31
-
32
-
33
-
34
-
35
-
36
-
37
-
38
 |
 |

16
Family Dollar Stores, Inc. and Subsidiaries
Management’s Discussion and Analysis of
Financial Condition and Results of Operations (continued)
decreased approximately 1.7%. Sales in fiscal 2002 were impacted by a space realloca-
tion program completed in all stores in January 2002 that reduced the space allocated
to shoes. The Company distributed two advertising circulars in fiscal 2002 and three
advertising circulars in fiscal 2001.
Hardlines merchandise includes primarily household chemical and paper products,
health and beauty aids, candy, snack and other food, electronics, housewares and
giftware, toys, school supplies, hardware and automotive supplies. Softlines merchan-
dise includes men’s, women’s, boy’s, girl’s and infant’s clothing and accessories,
shoes, and domestic items such as blankets, sheets and towels.
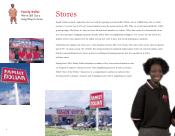
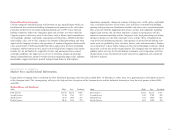
During fiscal 2003, the Company opened 475 stores and closed 64 stores for a net
addition of 411 stores, compared with the opening of 525 stores and closing of 50
stores for a net addition of 475 stores during fiscal 2002. In the last two years, the
Company’s traditional opportunistic approach to locating potential new sites has
become more strategic with the objective of improving new store performance. The
Company is realizing this objective with the sales performance of new stores (stores
open 13 months or less) equal to approximately 96% of the chain average in fiscal
2003 versus 88% in fiscal 2002. This strategic approach has lead to an increase in
the number of new stores opened in urban markets with approximately 55% of fiscal
2003 new stores opened in urban markets versus 40% of fiscal 2002 new stores. The
time it is taking to open new stores in urban markets, including time for the permit-
ting process and the completion of leasehold improvements and new construction,
is substantially longer than the time for opening stores in non-urban markets. This
impacted the number of stores the Company was able to open in fiscal 2003. The
Company also expanded or relocated 103 stores in fiscal 2003, compared with 121
stores that were expanded or relocated in fiscal 2002. In addition, approximately
42 stores in both fiscal 2003 and 2002 were renovated. The Company currently plans
to open approximately 565 stores and close approximately 60 stores for a net addition
of 505 stores during fiscal 2004. The Company also currently expects to renovate an
additional 50 stores and expand or relocate approximately 125 stores in fiscal 2004.
Store opening, closing, expansion, relocation and renovation plans are continuously
reviewed and are subject to change.
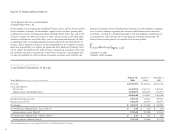
Cost of Sales and Margin
Cost of sales increased approximately 13.7% ($379.1 million) in fiscal 2003 compared
with fiscal 2002, and approximately 13.4% ($327.5 million) in fiscal 2002 compared
with fiscal 2001. These increases primarily reflected the additional sales volume in each
of the years. Cost of sales, as a percentage of net sales, was 66.2% in fiscal 2003, and
66.5% in both fiscal 2002 and fiscal 2001. The decrease in the cost of sales percentage
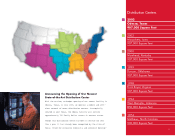
for fiscal 2003 was due primarily to improved initial margins and the favorable
impact of supply chain initiatives including the opening of the seventh full-service
distribution center and the implementation of a transportation management system.
The cost of sales percentages also are impacted by the effectiveness of merchandise
purchasing programs and by changes in merchandise shrinkage losses and freight
costs. The cost of sales percentage for fiscal 2002 remained at the same level as for
fiscal 2001 as the adverse margin impact of increased sales of basic consumables was
offset by lower markdowns of seasonal merchandise in the second and fourth quar-
ters of fiscal 2002.
For fiscal 2004, the Company’s plan is for the cost of sales percentage to decrease
slightly as compared to the percentage in fiscal 2003, primarily as a result of a
change in the accounting for certain vendor allowances. This change is pursuant to
Emerging Issues Task Force Issue No. 02-16, as described in “Recent Accounting
Pronouncements” below.
Selling, General and Administrative Expenses
Selling, general and administrative expenses increased approximately 15.2% ($160.4 mil-
lion) in fiscal 2003 compared with fiscal 2002, and approximately 13.6% ($126.6
million) in fiscal 2002 compared with fiscal 2001. The increases in these expenses
primarily were attributable to additional costs arising from the continued growth in
the number of stores in operation and the ramp-up of the seventh distribution center.
As a percentage of net sales, selling, general and administrative expenses were 25.6%
in fiscal 2003 and 25.3% in both fiscal 2002 and fiscal 2001. The increase in the sell-
ing, general and administrative expense for fiscal 2003 was due primarily to increased
insurance costs (primarily workers’ compensation) and legal related costs. In addi-
tion, the loss of planned sales due to opening of a lesser number of new stores than
originally planned also adversely impacted expense leverage. This was offset slightly
due to the elimination of an advertising circular distributed in fiscal 2002 at the end
of November and the beginning of December.
The percentage remained at the same level in fiscal 2002 as compared to fiscal 2001.
Increased labor productivity, lower utility costs and the elimination of an advertising
circular coupled with expense leverage from a 5.8% increase in existing store sales
were offset by rising insurance and store lease costs and the prior year leverage effect
of the extra week in fiscal 2001.
For fiscal 2004, the Company’s plan is for the selling, general and administrative
expense percentage of sales to increase slightly as compared to the percentage in fiscal
2003, primarily as result of the change in the accounting for certain vendor allowances.