Estee Lauder 2015 Annual Report Download - page 5
Download and view the complete annual report
Please find page 5 of the 2015 Estee Lauder annual report below. You can navigate through the pages in the report by either clicking on the pages listed below, or by using the keyword search tool below to find specific information within the annual report.-
 1
1 -
 2
2 -
 3
3 -
 4
4 -
 5
5 -
 6
6 -
 7
7 -
 8
8 -
 9
9 -
 10
10 -
 11
11 -
 12
12 -
 13
13 -
 14
14 -
 15
15 -
 16
16 -
17
-
18
-
19
-
20
-
21
-
22
-
23
-
24
-
25
-
26
-
27
-
28
-
29
-
30
-
31
-
32
-
33
-
34
-
35
-
36
-
37
-
38
-
39
-
40
-
41
-
42
-
43
-
44
-
45
-
46
-
47
-
48
-
49
-
50
-
51
-
52
-
53
-
54
-
55
-
56
-
57
-
58
-
59
-
60
-
61
-
62
-
63
-
64
-
65
-
66
-
67
-
68
-
69
-
70
-
71
-
72
-
73
-
74
-
75
-
76
-
77
-
78
-
79
-
80
-
81
-
82
-
83
-
84
-
85
-
86
-
87
-
88
-
89
-
90
-
91
-
92
-
93
-
94
-
95
-
96
-
97
-
98
-
99
-
100
-
101
-
102
-
103
-
104
-
105
-
106
-
107
-
108
-
109
-
110
-
111
-
112
-
113
-
114
-
115
-
116
-
117
-
118
-
119
-
120
-
121
-
122
-
123
-
124
-
125
-
126
-
127
-
128
 |
 |

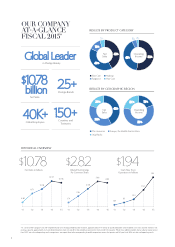
Fragrance
2
25+
Prestige Brands
4
0
K+
Global Employees
150+
Countries and
Territories
HISTORICAL OVERVIEW
OUR COMPANY
AT-A-GLANCE
FISCAL 2 015*
RESULTS BY PRODUCT CATEGORY
Net
Sales Operating
Income
Net
Sales Operating
Income
RESULTS BY GEOGRAPHIC REGION
$1
0
.78 $1.94
$2.82
Net Sales in billions Diluted Net Earnings
Per Common Share Cash Flow From
Operations in billions
$1
0
.
78
billion
Net Sales
in Prestige Beauty
Global Leader 42%52%
40%
41%
13%
5%
5%2%
Skin Care
The Americas
Makeup
Europe, the Middle East & Africa
Asia/Pacific
Hair Care
42%
19 %
38%59%
20%22%
‘11 ‘11 ‘11‘12 ‘12 ‘12‘13 ‘13 ‘13‘14 ‘14 ‘14
8.81
9.71
10.18
10.97 10.78 2.82
1.94
1.03
1.54
1.2 3
1.13
3.06
2.58
2.16
1.74
‘15‘15 ‘15
*As a result of the Company’s July 2014 implementation of its Strategic Modernization Initiative, approximately $178 million of accelerated orders were recorded as net sales and $82 million in net
earnings, equal to approximately $.21 per diluted common share in scal 2014 that would have occurred in the scal 2015 rst quarter. While these additional orders had an adverse impact on our
scal 2015 net sales and operating results comparisons, we expect there to be corresponding favorable comparisons on our rst quarter and full year scal 2016 net sales and operating results.