Estee Lauder 2015 Annual Report Download - page 12
Download and view the complete annual report
Please find page 12 of the 2015 Estee Lauder annual report below. You can navigate through the pages in the report by either clicking on the pages listed below, or by using the keyword search tool below to find specific information within the annual report.-
 1
1 -
 2
2 -
 3
3 -
 4
4 -
 5
5 -
 6
6 -
 7
7 -
 8
8 -
 9
9 -
 10
10 -
 11
11 -
 12
12 -
 13
13 -
 14
14 -
 15
15 -
 16
16 -
 17
17 -
 18
18 -
 19
19 -
 20
20 -
 21
21 -
 22
22 -
23
-
24
-
25
-
26
-
27
-
28
-
29
-
30
-
31
-
32
-
33
-
34
-
35
-
36
-
37
-
38
-
39
-
40
-
41
-
42
-
43
-
44
-
45
-
46
-
47
-
48
-
49
-
50
-
51
-
52
-
53
-
54
-
55
-
56
-
57
-
58
-
59
-
60
-
61
-
62
-
63
-
64
-
65
-
66
-
67
-
68
-
69
-
70
-
71
-
72
-
73
-
74
-
75
-
76
-
77
-
78
-
79
-
80
-
81
-
82
-
83
-
84
-
85
-
86
-
87
-
88
-
89
-
90
-
91
-
92
-
93
-
94
-
95
-
96
-
97
-
98
-
99
-
100
-
101
-
102
-
103
-
104
-
105
-
106
-
107
-
108
-
109
-
110
-
111
-
112
-
113
-
114
-
115
-
116
-
117
-
118
-
119
-
120
-
121
-
122
-
123
-
124
-
125
-
126
-
127
-
128
 |
 |

9
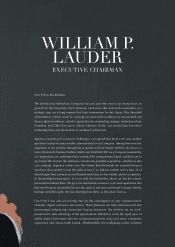
FABRIZIO
FREDA
PRESIDENT AND
CHIEF EXECUTIVE OFFICER
Dear Fellow Stockholders,
The Estée Lauder Companies delivered another year of strong nancial performance in
scal 2015, demonstrating the power of our business model, the diversity of our portfolio
and the strength of our execution. Our results were fueled by our multiple engines of growth
across brands, demographics, geographies and channels, signifying our proven resiliency
and agility, even against the backdrop of challenging market conditions in some areas.
We are continuing to build on our
beautiful momentum
by leveraging our multiple engines
of growth, combined with our brand building capabilities and our unrivaled creativity and
innovation, all of which have enabled us to deliver consistent, sustainable results for stockholders.
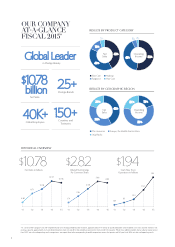
In scal 2015, we generated adjusted net sales of $11.0 billion, adjusted net earnings of
$1.18 billion and adjusted diluted earnings per share of $3.05. The strengthening of the
dollar relative to other currencies had an adverse effect on our results. In constant currency,
net sales rose 6 percent and diluted earnings per share increased 12 percent.* Cash ow
from operations increased 27 percent to $1.9 billion, providing ample resources to invest in
our business, while returning substantial cash to our stockholders. During the scal year,
we raised our dividend rate by 20 percent and repurchased nearly $1 billion of our
outstanding shares.
We are keenly focused on long-term value creation as we proactively manage our business
to remain well-positioned to generate impressive near-term results. Our 10-year Compass, a
vital long-range planning tool, helps us to anticipate emerging trends and direct our
investments appropriately. Consumer shopping behaviors and habits are undergoing a
profound transformation, driven by changing technology and distribution, the increasing
in uence of the Millennial demographic and the continued spending power of the Ageless
consumer. Through skillful planning and strategic decision making, we are well-positioned
in this dynamic environment.