Dell 2005 Annual Report Download - page 41
Download and view the complete annual report
Please find page 41 of the 2005 Dell annual report below. You can navigate through the pages in the report by either clicking on the pages listed below, or by using the keyword search tool below to find specific information within the annual report.-
 1
1 -
2
-
3
-
4
-
5
-
6
-
7
-
8
-
9
-
10
-
11
-
12
-
13
-
14
-
15
-
16
-
17
-
18
-
19
-
20
-
21
-
22
-
23
-
24
-
25
-
26
-
27
-
28
-
29
-
30
-
 31
31 -
 32
32 -
 33
33 -
 34
34 -
 35
35 -
 36
36 -
 37
37 -
 38
38 -
 39
39 -
 40
40 -
 41
41 -
 42
42 -
 43
43 -
 44
44 -
 45
45 -
 46
46 -
 47
47 -
 48
48 -
 49
49 -
 50
50 -
 51
51 -
52
-
53
-
54
-
55
-
56
-
57
-
58
-
59
-
60
-
61
-
62
-
63
-
64
-
65
-
66
-
67
-
68
-
69
-
70
-
71
-
72
-
73
-
74
-
75
-
76
-
77
-
78
-
79
-
80
 |
 |
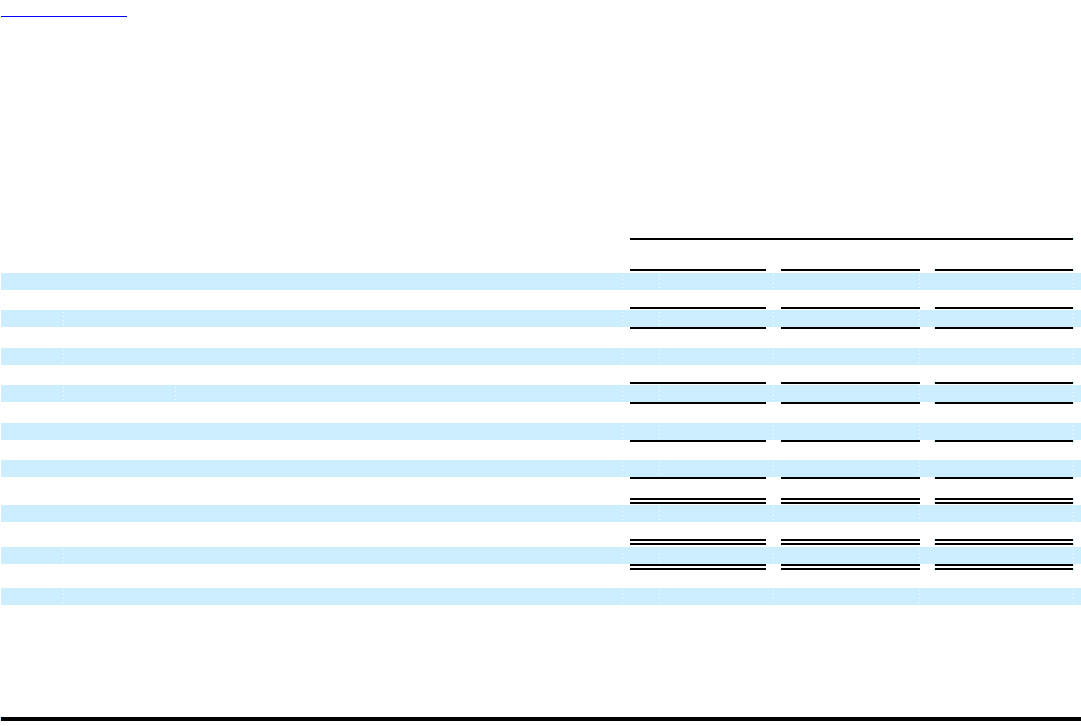
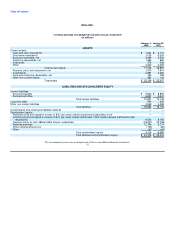
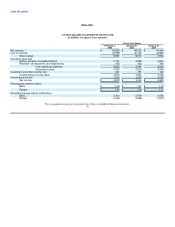
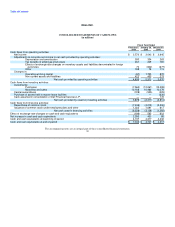
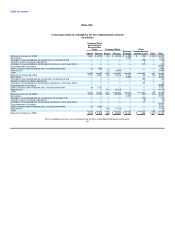
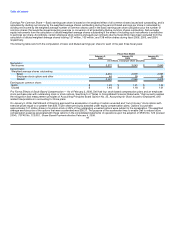
Table of Contents
DELL INC.
CONSOLIDATED STATEMENTS OF INCOME
(in millions, except per share amounts)
Fiscal Year Ended
February 3, January 28, January 30,
2006 2005 2004
Net revenue $ 55,908 $ 49,205 $ 41,444
Cost of revenue 45,958 40,190 33,892
Gross margin 9,950 9,015 7,552
Operating expenses:
Selling, general, and administrative 5,140 4,298 3,544
Research, development, and engineering 463 463 464
Total operating expenses 5,603 4,761 4,008
Operating income 4,347 4,254 3,544
Investment and other income, net 227 191 180
Income before income taxes 4,574 4,445 3,724
Income tax provision 1,002 1,402 1,079
Net income $ 3,572 $ 3,043 $ 2,645
Earnings per common share:
Basic $ 1.49 $ 1.21 $ 1.03
Diluted $ 1.46 $ 1.18 $ 1.01
Weighted average shares outstanding:
Basic 2,403 2,509 2,565
Diluted 2,449 2,568 2,619
The accompanying notes are an integral part of these consolidated financial statements.
38