Dell 2005 Annual Report Download - page 28
Download and view the complete annual report
Please find page 28 of the 2005 Dell annual report below. You can navigate through the pages in the report by either clicking on the pages listed below, or by using the keyword search tool below to find specific information within the annual report.-
 1
1 -
2
-
3
-
4
-
5
-
6
-
7
-
8
-
9
-
10
-
11
-
12
-
13
-
14
-
15
-
16
-
17
-
 18
18 -
 19
19 -
 20
20 -
 21
21 -
 22
22 -
 23
23 -
 24
24 -
 25
25 -
 26
26 -
 27
27 -
 28
28 -
 29
29 -
 30
30 -
 31
31 -
 32
32 -
 33
33 -
 34
34 -
 35
35 -
 36
36 -
 37
37 -
 38
38 -
39
-
40
-
41
-
42
-
43
-
44
-
45
-
46
-
47
-
48
-
49
-
50
-
51
-
52
-
53
-
54
-
55
-
56
-
57
-
58
-
59
-
60
-
61
-
62
-
63
-
64
-
65
-
66
-
67
-
68
-
69
-
70
-
71
-
72
-
73
-
74
-
75
-
76
-
77
-
78
-
79
-
80
 |
 |

Table of Contents
additional charges for product rationalizations and workforce realignment recognized in the third quarter. These charges were offset by
favorable pricing on certain commodity components, higher revenue to leverage fixed production costs, and a favorable shift in product mix as
compared to the prior year periods. In fiscal 2005, gross margin as a percentage of net revenue improved slightly to 18.3% compared to 18.2%
for fiscal 2004. This year-over-year improvement was primarily driven by our continued cost savings initiatives.
As part of our focus on improving margins, we remain committed to reducing costs in three primary areas: warranty costs, structural materials,
and infrastructure. Cost savings initiatives include providing certain customer technical support and back-office functions from cost-effective
locations as well as driving more efficient processes and tools globally. We routinely pass cost reductions on to our customers to improve
customer value and increase sales.
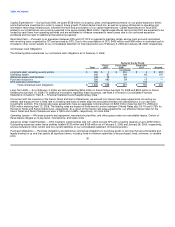
Operating Expenses
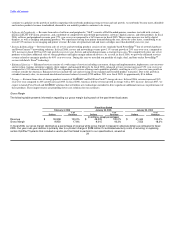
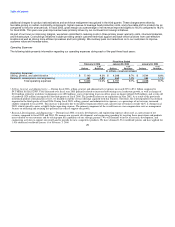
The following table presents information regarding our operating expenses during each of the past three fiscal years:
Fiscal Year Ended
February 3, 2006 January 28, 2005 January 30, 2004
% of % of % of
Dollars Revenue Dollars Revenue Dollars Revenue
(in millions, except percentages)
Operating Expenses:
Selling, general, and administrative $ 5,140 9.2% $ 4,298 8.7% $ 3,544 8.6%
Research, development, and engineering 463 0.8% 463 1.0% 464 1.1%
Total operating expenses $ 5,603 10.0% $ 4,761 9.7% $ 4,008 9.7%
• Selling, General, and Administrative — During fiscal 2006, selling, general, and administrative expenses increased 20% to $5.1 billion compared to
$4.3 billion for fiscal 2005. Costs increased over fiscal year 2005 primarily related to increased advertising costs, headcount growth, as well as charges of
$104 million related to workforce realignment costs ($50 million), costs of operating leases on office space no longer utilized ($25 million), and a write-off
of goodwill ($29 million) recognized in the third quarter of fiscal 2006. The goodwill relates to an acquisition in June 2002. As a result of the previously
mentioned product rationalization review, we decided to end the service offerings acquired with this business. Therefore, the related goodwill was deemed
impaired in the third quarter of fiscal 2006. During fiscal 2005, selling, general, and administrative expenses, as a percentage of net revenue, increased
slightly compared to fiscal 2004. This increase is primarily due to our global expansion efforts and a greater mix of business outside the U.S. during fiscal
2005, which typically carries a slightly higher operating expense. The primary component of the overall increase was compensation costs as management
focuses on attracting and retaining key personnel in order to support our growth.
• Research, Development, and Engineering — During fiscal 2006, research, development, and engineering expenses decreased, as a percentage of net
revenue, compared to fiscal 2005 and 2004. We manage our research, development, and engineering spending by targeting those innovations and products
most valuable to our customers and by relying upon the capabilities of our strategic partners. We will continue to invest in research, development, and
engineering activities to support our growth and to provide for new, competitive products. We have obtained 1,581 worldwide patents and have applied for
1,416 additional worldwide patents as of February 3, 2006. 25