Dell 1999 Annual Report Download - page 34
Download and view the complete annual report
Please find page 34 of the 1999 Dell annual report below. You can navigate through the pages in the report by either clicking on the pages listed below, or by using the keyword search tool below to find specific information within the annual report.-
 1
1 -
2
-
3
-
4
-
5
-
6
-
7
-
8
-
9
-
10
-
11
-
12
-
13
-
14
-
15
-
16
-
17
-
18
-
19
-
20
-
21
-
22
-
23
-
 24
24 -
 25
25 -
 26
26 -
 27
27 -
 28
28 -
 29
29 -
 30
30 -
 31
31 -
 32
32 -
 33
33 -
 34
34 -
 35
35 -
 36
36 -
 37
37 -
 38
38 -
 39
39 -
 40
40 -
 41
41 -
 42
42 -
 43
43 -
 44
44 -
45
-
46
-
47
-
48
-
49
 |
 |

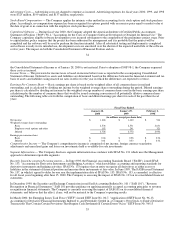
Property, plant and equipment:
Land and buildings $ 229 $ 172
Computer equipment 277 205
Machinery and other equipment 383 252
Leasehold improvements 251 146
Total property, plant and equipment 1,140 775
Accumulated depreciation and amortization (375) (252)
$ 765 $ 523
Accrued and other current liabilities:
Accrued compensation $ 337 $ 355
Deferred revenue on warranty contracts 190 204
Other 1,127 739
$ 1,654 $ 1,298
Other noncurrent liabilities:
Deferred revenue on warranty contracts $ 271 $ 237
Other 192 112
$ 463 $ 349
47
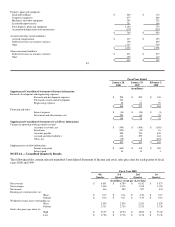
Fiscal Year Ended
January 28, January 29, February 1,
2000 1999 1998
(in millions)
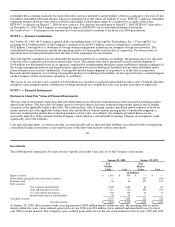
Supplemental Consolidated Statement of Income Information
Research, development and engineering expenses:
Research and development expenses $ 292 $ 209 $ 145
Purchased research and development 194 — —
Engineering expenses 82 63 59
$ 568 $ 272 $ 204
Financing and other:
Interest expense $ (34) $ (26) $ (3)
Investment and other income, net 222 64 55
$ 188 $ 38 $ 52
Supplemental Consolidated Statement of Cash Flows Information
Changes in operating working capital accounts:
Accounts receivable, net $ (394) $ (598) $ (638)
Inventories (123) (41) 16
Accounts payable 988 743 638
Accrued and other liabilities 416 255 644
Other, net (75) 8 (295)
$ 812 $ 367 $ 365
Supplemental cash flow information:
Income taxes paid $ (363) $ 138 $ 180
Interest paid 34 19 3
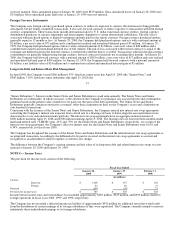
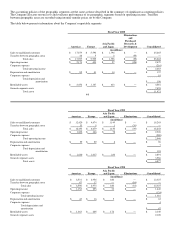
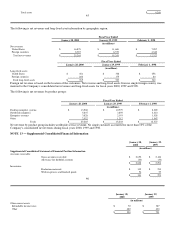
NOTE 14 — Unaudited Quarterly Results
The following tables contain selected unaudited Consolidated Statement of Income and stock sales price data for each quarter of fiscal
years 2000 and 1999.
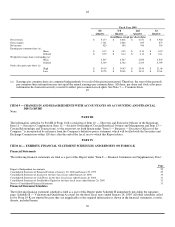
Fiscal Year 2000
4th 3rd 2nd 1st
Quarter Quarter Quarter Quarter
(in millions, except per share data)
Net revenues $ 6,801 $ 6,784 $ 6,142 $ 5,537
Gross margin 1,304 1,370 1,354 1,190
Net income 436 289 507 434
Earnings per common share (a):
Basic $ 0.17 $ 0.11 $ 0.20 $ 0.17
Diluted $ 0.16 $ 0.11 $ 0.19 $ 0.16
Weighted average shares outstanding (a):
Basic 2,559 2,538 2,524 2,528
Diluted 2,731 2,724 2,725 2,738
Stock sales prices per share (a):
High $ 53.97 $ 49.94 $ 45.06 $ 55.00
Low $ 37.06 $ 37.38 $ 31.38 $ 35.38