Dell 1999 Annual Report Download - page 18
Download and view the complete annual report
Please find page 18 of the 1999 Dell annual report below. You can navigate through the pages in the report by either clicking on the pages listed below, or by using the keyword search tool below to find specific information within the annual report.-
 1
1 -
2
-
3
-
4
-
5
-
6
-
7
-
 8
8 -
 9
9 -
 10
10 -
 11
11 -
 12
12 -
 13
13 -
 14
14 -
 15
15 -
 16
16 -
 17
17 -
 18
18 -
 19
19 -
 20
20 -
 21
21 -
 22
22 -
 23
23 -
 24
24 -
 25
25 -
 26
26 -
 27
27 -
 28
28 -
29
-
30
-
31
-
32
-
33
-
34
-
35
-
36
-
37
-
38
-
39
-
40
-
41
-
42
-
43
-
44
-
45
-
46
-
47
-
48
-
49
 |
 |

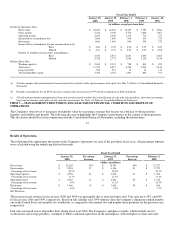
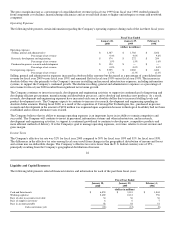
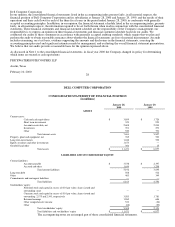
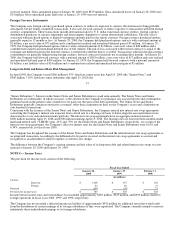
(a) All cash and investments information has been retroactively restated to reflect the reclassification of cash and cash equivalents, short term investments,
long term investments, and equity securities and other investments. See Note 1 of Notes to Consolidated Financial Statements.
The Company ended fiscal year 2000 with $6.9 billion in cash and investments, more than double the prior year level. During fiscal
year 2000, the Company generated $3.9 billion in cash flows from operating activities, which represents the Company's principal
source of cash. Cash flows from operating activities resulted primarily from the Company's net income, changes in operating working
capital and income tax benefits resulting from the exercise of employee stock options.
Throughout fiscal year 2000, the Company invested a significant portion of its available cash in highly liquid investments with
maturities of three months or less at date of acquisition to primarily minimize principal risk and maintain liquidity. Additionally, the
Company has approximately $3 billion in other short-term and long-term investments at the end of fiscal year 2000, as compared to
approximately $1.5 billion at year-end in fiscal 1999.
During fiscal year 2000, the Company continued to improve upon its efficient asset management. Days of sales in accounts receivable
decreased two days from fiscal year 1999 to 34 days, while days of supply in inventory remained flat in fiscal year 2000. This,
combined with a four-day increase in days in accounts payable, resulted in an improvement in the Company's cash conversion cycle to
a negative 18 days in fiscal year 2000 from a negative 12 days in fiscal year 1999. As a result, the Company's return on invested
capital, a key indicator of efficient asset management, increased to 243%, excluding a charge for purchased in-process research and
development (as a result of the ConvergeNet acquisition), in fiscal year 2000 from 120% (restated to reflect reclassification of cash
and investments in fiscal year 2000) in fiscal year 1999.
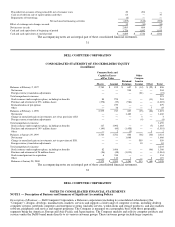
During fiscal year 2000, the Company repurchased 56 million shares of common stock for an aggregate cost of $1.1 billion, primarily
to manage the dilution resulting from shares issued under the Company's employee stock plans. The Company is currently authorized
to repurchase up to 145 million additional shares of its outstanding common stock and anticipates that repurchases will constitute a
major use of future cash resources. At January 28, 2000 and January 29, 1999, the Company held equity instrument contracts that
relate to the purchase of 118 million and 49 million shares of common stock, respectively, at an average cost of $41 and $14 per share,
respectively. Additionally, at January 28, 2000 and January 29, 1999, the Company had outstanding put obligations covering
69 million and 33 million shares, respectively, at an average exercise price of $39 and $11, respectively. For additional information
regarding the Company's stock repurchase program, see Note 7 of Notes to Consolidated Financial Statements included in "Item 8 —
Financial Statements and Supplementary Data" below.
23
The Company utilized $397 million in cash during fiscal year 2000 to improve and equip its manufacturing and office facilities as the
Company continues to grow. Cash flows for similar capital expenditures for fiscal year 2001 are expected to be approximately
$500 million.
The Company maintains master lease facilities providing the capacity to fund up to $820 million. The combined facilities provide for
the ability of the Company to lease certain real property, buildings and equipment to be constructed or acquired. At January 28, 2000,
$365 million of the combined facilities had been utilized.
In April 1998, the Company issued $200 million in Senior Notes and $300 million in Senior Debentures. For additional information
regarding these issuances, see Note 3 of Notes to Consolidated Financial Statements included in "Item 8 — Financial Statements and
Supplementary Data" below.
The Company maintains a $250 million revolving credit facility, which expires in June 2002. At January 28, 2000, this facility was
unused.
Management believes that the Company has sufficient resources from cash provided from operations and available borrowings to
support its operations and capital requirements for at least the next 12 months.
Market Risk
The Company is exposed to a variety of risks, including foreign currency exchange rate fluctuations and changes in the market value
of its investments. In the normal course of business, the Company employs established policies and procedures to manage these risks.
Foreign Currency Hedging Activities
The Company's objective in managing its exposure to foreign currency exchange rate fluctuations is to reduce the impact of adverse
fluctuations in earnings and cash flows associated with foreign currency exchange rate changes. Accordingly, the Company utilizes
foreign currency option contracts and forward contracts to hedge its exposure on anticipated transactions and firm commitments in
most of the foreign countries in which the Company operates. The principal currencies hedged during fiscal year 2000 were the British
pound, Japanese yen, Euro and Canadian dollar. The Company monitors its foreign currency exchange exposures daily to ensure the
overall effectiveness of its foreign currency hedge positions. However, there can be no assurance the Company's foreign currency
hedging activities will substantially offset the impact of fluctuations in currency exchange rates on its results of operations and
financial position.
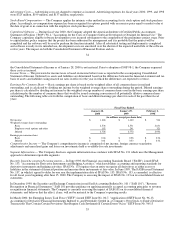
Based on the Company's foreign currency exchange instruments outstanding at January 28, 2000, the Company estimates a maximum
potential one-day loss in fair value of approximately $17 million, using a Value-at-Risk ("VAR") model. The VAR model estimates
were made assuming normal market conditions and a 95% confidence level. The Company used a Monte Carlo simulation type model