Dell 1999 Annual Report Download - page 15
Download and view the complete annual report
Please find page 15 of the 1999 Dell annual report below. You can navigate through the pages in the report by either clicking on the pages listed below, or by using the keyword search tool below to find specific information within the annual report.-
 1
1 -
2
-
3
-
4
-
 5
5 -
 6
6 -
 7
7 -
 8
8 -
 9
9 -
 10
10 -
 11
11 -
 12
12 -
 13
13 -
 14
14 -
 15
15 -
 16
16 -
 17
17 -
 18
18 -
 19
19 -
 20
20 -
 21
21 -
 22
22 -
 23
23 -
 24
24 -
 25
25 -
26
-
27
-
28
-
29
-
30
-
31
-
32
-
33
-
34
-
35
-
36
-
37
-
38
-
39
-
40
-
41
-
42
-
43
-
44
-
45
-
46
-
47
-
48
-
49
 |
 |

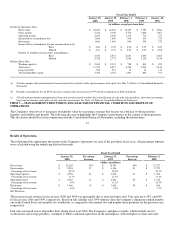
Fiscal Year Ended
January 28, January 29, February 1, February 2, January 28,
2000 1999 1998 1997 1996
(in millions, except per share data)
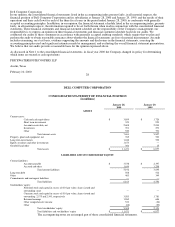
Results of Operations Data:
Net revenue $ 25,265 $ 18,243 $ 12,327 $ 7,759 $ 5,296
Gross margin 5,218 4,106 2,722 1,666 1,067
Operating income 2,263 2,046 1,316 714 377
Income before extraordinary loss 1,666 1,460 944 531 272
Net income 1,666 1,460 944 518 272
Income before extraordinary loss per common share(a)(b):
Basic $ 0.66 $ 0.58 $ 0.36 $ 0.19 $ 0.09
Diluted $ 0.61 $ 0.53 $ 0.32 $ 0.17 $ 0.08
Number of weighted average shares outstanding(a):
Basic 2,536 2,531 2,631 2,838 2,863
Diluted 2,728 2,772 2,952 3,126 3,158
Balance Sheet Data:
Working capital(c) $ 2,489 $ 2,112 $ 758 $ 891 $ 923
Total assets 11,471 6,877 4,268 2,993 2,148
Long-term debt 508 512 17 18 113
Total stockholders' equity 5,308 2,321 1,293 806 973
(a) All share and per share information has been retroactively restated to reflect prior common stock splits. See Note 7 of Notes to Consolidated Financial
Statements.
(b) Excludes extraordinary loss of $0.01 basic per common share for fiscal year 1997 related to repurchase of debt instruments.
(c) All cash and investments information has been retroactively restated to reflect the reclassification of cash and cash equivalents, short term investments,
long term investments, and equity security and other investments. See Note 1 of Notes to Consolidated Financial Statements.
ITEM 7 — MANAGEMENT'S DISCUSSION AND ANALYSIS OF FINANCIAL CONDITION AND RESULTS OF
OPERATIONS
The Company's objective is to maximize stockholder value by executing a strategy that focuses on a balance of three priorities:
liquidity, profitability and growth. The following discussion highlights the Company's performance in the context of these priorities.
This discussion should be read in conjunction with the Consolidated Financial Statements, including the related notes.
19
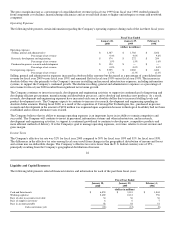
Results of Operations
The following table summarizes the results of the Company's operations for each of the past three fiscal years. All percentage amounts
were calculated using the underlying data in thousands.
Fiscal Year Ended
January 28, Percentage January 29, Percentage February 1,
2000 Increase 1999 Increase 1998
(dollars in millions)
Net revenue $ 25,265 38% $ 18,243 48% $ 12,327
Gross margin $ 5,218 27 $ 4,106 51 $ 2,722
Percentage of net revenue 20.7% 22.5% 22.1%
Operating expenses $ 2,955 43 $ 2,060 47 $ 1,406
Percentage of net revenue 11.7% 11.3% 11.4%
Operating income $ 2,263 11 $ 2,046 56 $ 1,316
Percentage of net revenue 9.0% 11.2% 10.7%
Net income $ 1,666 14 $ 1,460 55 $ 944
Percentage of net revenue 6.6% 8.0% 7.7%
Net Revenue
The increase in net revenue for fiscal years 2000 and 1999 was principally due to increased units sold. Unit sales grew 50% and 64%
for fiscal years 2000 and 1999, respectively. Based on full calendar year 1999 industry data, the Company's shipments ranked number
one in the United States and number two worldwide, as compared to the number two and number three positions for the previous year,
respectively.
Unit sales increased across all product lines during fiscal year 2000. The Company's enterprise systems, which include servers,
workstations and storage products, continued to build a substantial presence in the marketplace, with enterprise systems unit sales