Dell 1999 Annual Report Download - page 22
Download and view the complete annual report
Please find page 22 of the 1999 Dell annual report below. You can navigate through the pages in the report by either clicking on the pages listed below, or by using the keyword search tool below to find specific information within the annual report.-
 1
1 -
2
-
3
-
4
-
5
-
6
-
7
-
8
-
9
-
10
-
11
-
 12
12 -
 13
13 -
 14
14 -
 15
15 -
 16
16 -
 17
17 -
 18
18 -
 19
19 -
 20
20 -
 21
21 -
 22
22 -
 23
23 -
 24
24 -
 25
25 -
 26
26 -
 27
27 -
 28
28 -
 29
29 -
 30
30 -
 31
31 -
 32
32 -
33
-
34
-
35
-
36
-
37
-
38
-
39
-
40
-
41
-
42
-
43
-
44
-
45
-
46
-
47
-
48
-
49
 |
 |
29
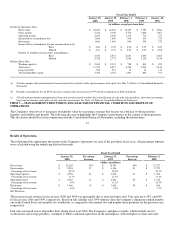
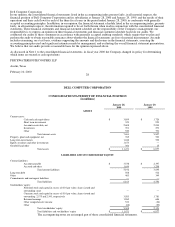
DELL COMPUTER CORPORATION
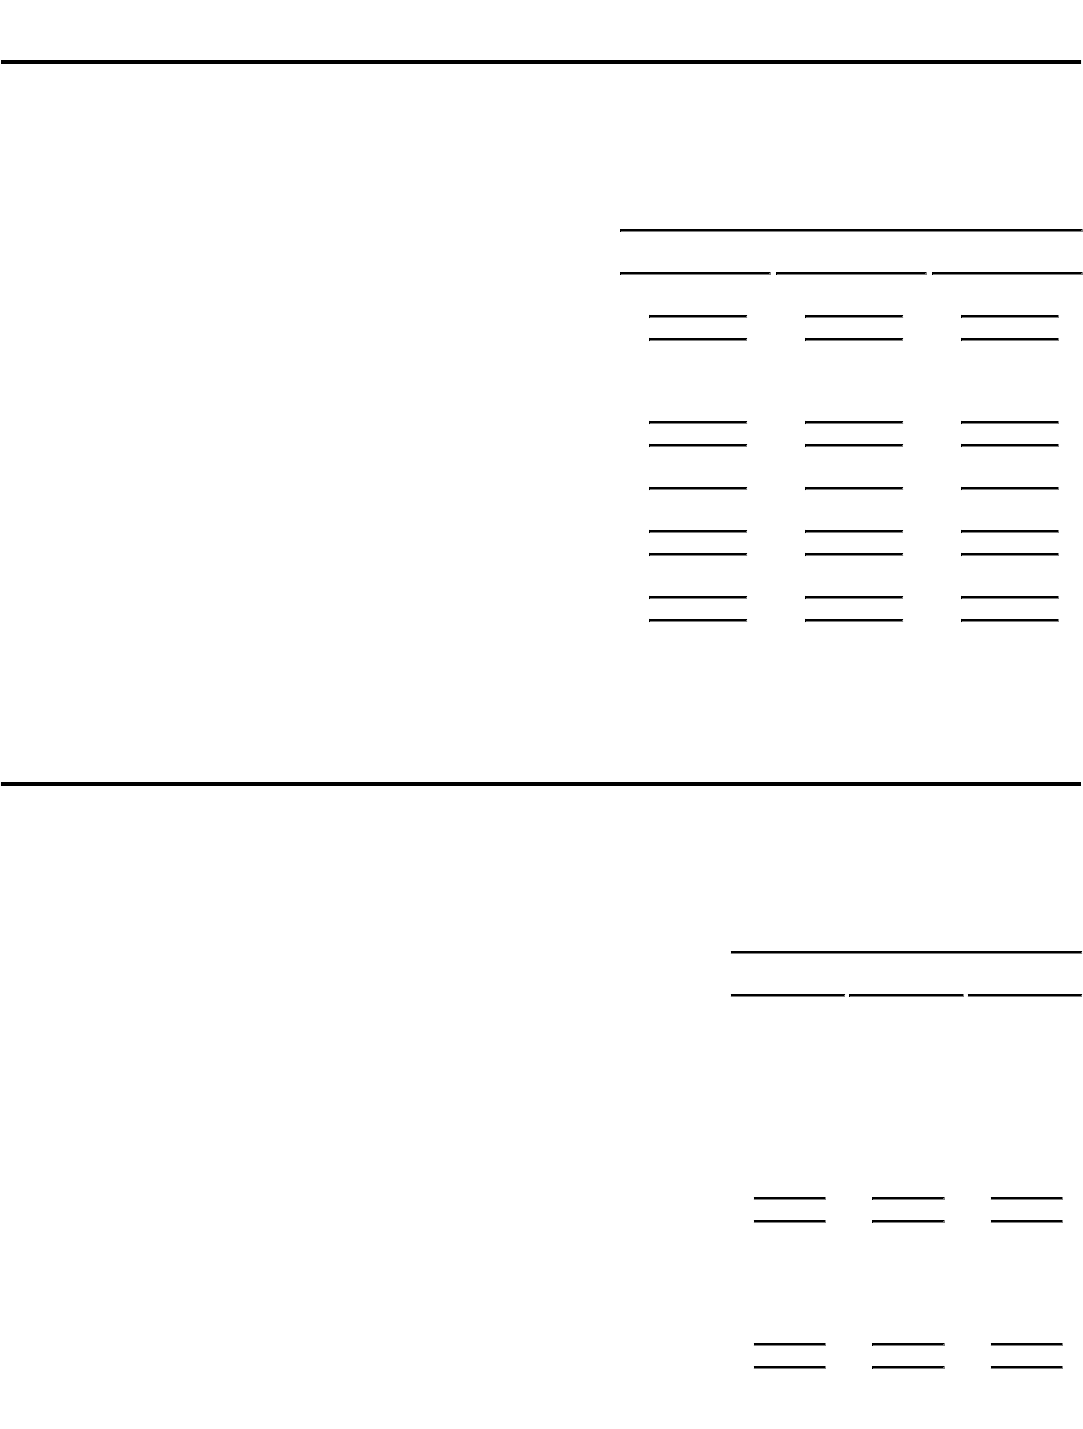
CONSOLIDATED STATEMENT OF INCOME
(in millions, except per share amounts)
Fiscal Year Ended
January 28, January 29, February 1,
2000 1999 1998
Net revenue $ 25,265 $ 18,243 $ 12,327
Cost of revenue 20,047 14,137 9,605
Gross margin 5,218 4,106 2,722
Operating expenses:
Selling, general and administrative 2,387 1,788 1,202
Research, development and engineering 374 272 204
Purchased in-process research and development 194 — —
Total operating expenses 2,955 2,060 1,406
Operating income 2,263 2,046 1,316
Financing and other 188 38 52
Income before income taxes 2,451 2,084 1,368
Provision for income taxes 785 624 424
Net income $ 1,666 $ 1,460 $ 944
Earnings per common share:
Basic $ 0.66 $ 0.58 $ 0.36
Diluted $ 0.61 $ 0.53 $ 0.32
Weighted average shares outstanding:
Basic 2,536 2,531 2,631
Diluted 2,728 2,772 2,952
The accompanying notes are an integral part of these consolidated financial statements.
30
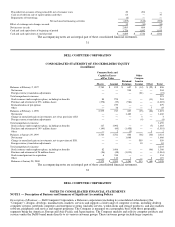
DELL COMPUTER CORPORATION
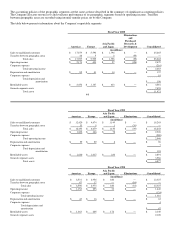
CONSOLIDATED STATEMENT OF CASH FLOWS
(in millions)
Fiscal Year Ended
January 28, January 29, February 1,
2000 1999 1998
Cash flows from operating activities:
Net income $ 1,666 $ 1,460 $ 944
Adjustments to reconcile net income to net cash provided by operating activities:
Depreciation and amortization 156 103 67
Tax benefits of employee stock plans 1,040 444 164
Purchased in-process research and development 194 — —
Other (24) 11 24
Changes in:
Operating working capital 812 367 365
Non-current assets and liabilities 82 51 28
Net cash provided by operating activities 3,926 2,436 1,592
Cash flows from investing activities:
Investments:
Purchases (3,101) (1,938) (1,492)
Maturities and sales 2,319 1,304 1,022
Cash payments for acquisition, net of cash acquired (4) — —
Capital expenditures (397) (296) (187)
Net cash used in investing activities (1,183) (930) (657)
Cash flows from financing activities:
Purchase of common stock (1,061) (1,518) (1,023)
Issuance of common stock under employee plans 289 212 88