Dell 1999 Annual Report Download - page 16
Download and view the complete annual report
Please find page 16 of the 1999 Dell annual report below. You can navigate through the pages in the report by either clicking on the pages listed below, or by using the keyword search tool below to find specific information within the annual report.-
 1
1 -
2
-
3
-
4
-
5
-
 6
6 -
 7
7 -
 8
8 -
 9
9 -
 10
10 -
 11
11 -
 12
12 -
 13
13 -
 14
14 -
 15
15 -
 16
16 -
 17
17 -
 18
18 -
 19
19 -
 20
20 -
 21
21 -
 22
22 -
 23
23 -
 24
24 -
 25
25 -
 26
26 -
27
-
28
-
29
-
30
-
31
-
32
-
33
-
34
-
35
-
36
-
37
-
38
-
39
-
40
-
41
-
42
-
43
-
44
-
45
-
46
-
47
-
48
-
49
 |
 |

growing 81% during fiscal year 2000. Notebook computer unit sales increased 61%, primarily as the result of pricing actions and the
launch of new notebook computer products. Desktop computer systems unit sales increased 46% during fiscal year 2000. This
increase was primarily attributable to the Company's aggressive market penetration of new and higher-end products.
Unit sales grew during fiscal year 1999, also the result of increased demand for the Company's products across all product lines.
During fiscal year 1999, on a unit sales basis, enterprise systems grew 130%, notebooks grew 108% and desktops grew 55%, as the
Company continued to introduce products utilizing the latest technology.
Average revenue per unit sold in fiscal year 2000 decreased 8% compared to fiscal year 1999, partially offsetting the effects of the
increase in unit sales on consolidated net revenue. The decrease was primarily due to the Company's pricing strategy in the prevailing
competitive environment.
Average revenue per unit sold in fiscal year 1999 decreased 10% compared to fiscal year 1998, partially offsetting the effects of the
increase in unit sales on consolidated net revenue. The decrease was primarily due to price reductions resulting from component cost
declines.
20
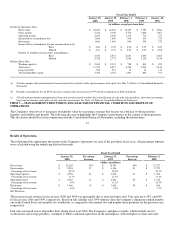
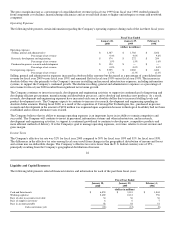
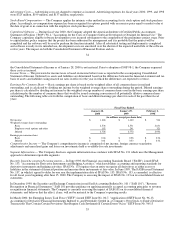
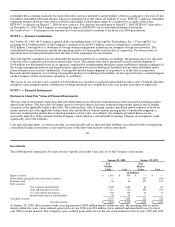
The Company experienced growth in net revenue in all geographic regions in both fiscal years 2000 and 1999. The following table
summarizes the Company's net revenue by geographic region for each of the past three fiscal years:
Fiscal Year Ended
January 28, Percentage January 29, Percentage February 1,
2000 Increase 1999 Increase 1998
(dollars in millions)
Net revenue:
Americas $ 17,879 44% $ 12,420 46% $ 8,531
Europe 5,590 20 4,674 58 2,956
Asia-Pacific and Japan 1,796 56 1,149 37 840
Consolidated net revenue $ 25,265 $ 18,243 $ 12,327
In the Americas region, net revenue grew 44% and 46% in fiscal years 2000 and 1999, respectively, as the Company continued its
efforts to strengthen its consumer, small-to-medium business and large corporate customer groups. Net revenue for the Europe region
increased by 20% and 58% in fiscal years 2000 and 1999, respectively. Year-over-year growth in Europe slowed during fiscal 2000
with rates by country ranging generally between 15% and 66%, as compared to fiscal 1999 when the majority of countries
experienced revenue growth in excess of 50%. Asia-Pacific and Japan revenues increased 56% in fiscal year 2000, compared to a 37%
increase in fiscal year 1999. Consolidated net revenue includes worldwide service revenue of $1.8 million and $1 million for fiscal
years 2000 and 1999, respectively.
Management believes that opportunity exists for continued worldwide growth by increasing the Company's market presence in its
existing markets, entering new markets and pursuing additional product opportunities. The Company continues to expand its product
offerings to meet a variety of customer needs. Also, the Company continues to enhance and improve the reputation, quality and
breadth of all of its product lines and services. The Company is continuing its efforts to strengthen its position in enterprise systems by
introducing advanced technologies to serve the growing needs for these products. To accommodate its growth during fiscal year 2000,
the Company opened a new manufacturing facility near Nashville, Tennessee and added a new manufacturing facility to its operations
in Austin, Texas. The Company also opened a new manufacturing facility and call center in Eldorado do Sul, Brazil.
During fiscal year 2000, the Company increased its focus on the Internet infrastructure market. This includes initiatives such as the
formation of the Internet Partner Division, which will provide customers the servers, storage and services to build, expand and
enhance their own Internet infrastructures and capabilities. Other offerings include web hosting services and an Internet service
provider operation called www.dellnet.com . The Company also provides this market with server and storage products, which
comprised 13% of the Company's overall sales revenue, up from 10% in fiscal year 1999. The Company was ranked number two in
both the United States and worldwide in server unit sales according to 1999 calendar year industry data, and was number two and
number four in calendar 1998 for United States and worldwide server unit sales, respectively.
Gross Margin
The decrease in gross margin as a percentage of consolidated net revenue in fiscal year 2000 over fiscal year 1999 was primarily
attributable to increased component costs, in part due to a higher than expected cost increase for memory components during the last
half of the year. The average revenue per unit decreased 8% from fiscal 2000 over fiscal 1999, also contributing to the decrease in
gross margin.
21