Dell 1999 Annual Report Download - page 32
Download and view the complete annual report
Please find page 32 of the 1999 Dell annual report below. You can navigate through the pages in the report by either clicking on the pages listed below, or by using the keyword search tool below to find specific information within the annual report.-
 1
1 -
2
-
3
-
4
-
5
-
6
-
7
-
8
-
9
-
10
-
11
-
12
-
13
-
14
-
15
-
16
-
17
-
18
-
19
-
20
-
21
-
 22
22 -
 23
23 -
 24
24 -
 25
25 -
 26
26 -
 27
27 -
 28
28 -
 29
29 -
 30
30 -
 31
31 -
 32
32 -
 33
33 -
 34
34 -
 35
35 -
 36
36 -
 37
37 -
 38
38 -
 39
39 -
 40
40 -
 41
41 -
 42
42 -
43
-
44
-
45
-
46
-
47
-
48
-
49
 |
 |

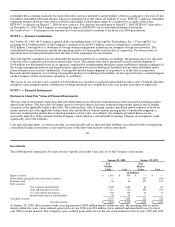
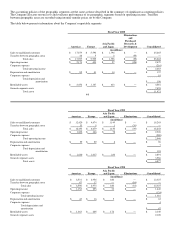
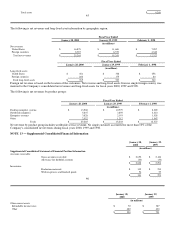
The accounting policies of the geographic segments are the same as those described in the summary of significant accounting policies.
The Company allocates resources to and evaluates performance of its geographic segments based on operating income. Transfers
between geographic areas are recorded using internal transfer prices set by the Company.
The table below presents information about the Company's reportable segments:
Fiscal Year 2000
Eliminations
and
Purchased
Asia Pacific Research &
Americas Europe and Japan Development Consolidated
(in millions)
Sales to unaffiliated customers $ 17,879 $ 5,590 $ 1,796 $ — $ 25,265
Transfers between geographic areas 48 5 2 (55) —
Total sales $ 17,927 $ 5,595 $ 1,798 $ (55) $ 25,265
Operating income $ 2,173 $ 403 $ 97 $ (194) $ 2,479
Corporate expenses (216)
Total operating income $ 2,263
Depreciation and amortization $ 82 $ 41 $ 14 $ — $ 137
Corporate expenses 19
Total depreciation and
amortization $ 156
Identifiable assets $ 2,456 $ 1,147 $ 413 $ — $ 4,016
General corporate assets 7,455
Total assets $ 11,471
44
Fiscal Year 1999
Asia Pacific
Americas Europe and Japan Eliminations Consolidated
(in millions)
Sales to unaffiliated customers $ 12,420 $ 4,674 $ 1,149 $ — $ 18,243
Transfers between geographic areas 33 5 1 (39) —
Total sales $ 12,453 $ 4,679 $ 1,150 $ (39) $ 18,243
Operating income $ 1,802 $ 446 $ 78 $ — $ 2,326
Corporate expenses (280)
Total operating income $ 2,046
Depreciation and amortization $ 59 $ 29 $ 8 $ — $ 96
Corporate expenses 7
Total depreciation and
amortization $ 103
Identifiable assets $ 1,640 $ 1,017 $ 234 $ — $ 2,891
General corporate assets 3,986
Total assets $ 6,877
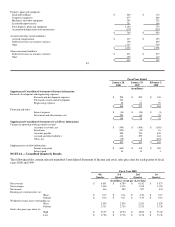
Fiscal Year 1998
Asia Pacific
Americas Europe and Japan Eliminations Consolidated
(in millions)
Sales to unaffiliated customers $ 8,531 $ 2,956 $ 840 — $ 12,327
Transfers between geographic areas 67 17 — (84) —
Total sales $ 8,598 $ 2,973 $ 840 $ (84) $ 12,327
Operating income $ 1,152 $ 255 $ 33 $ — $ 1,440
Corporate expenses (124)
Total operating income $ 1,316
Depreciation and amortization $ 42 $ 16 $ 5 $ — $ 63
Corporate expenses 4
Total depreciation and
amortization $ 67
Identifiable assets $ 1,363 $ 605 $ 172 $ — $ 2,140
General corporate assets 2,128