ComEd 2001 Annual Report Download - page 92
Download and view the complete annual report
Please find page 92 of the 2001 ComEd annual report below. You can navigate through the pages in the report by either clicking on the pages listed below, or by using the keyword search tool below to find specific information within the annual report.-
 1
1 -
2
-
3
-
4
-
5
-
6
-
7
-
8
-
9
-
10
-
11
-
12
-
13
-
14
-
15
-
16
-
17
-
18
-
19
-
20
-
21
-
22
-
23
-
24
-
25
-
26
-
27
-
28
-
29
-
30
-
31
-
32
-
33
-
34
-
35
-
36
-
37
-
38
-
39
-
40
-
41
-
42
-
43
-
44
-
45
-
46
-
47
-
48
-
49
-
50
-
51
-
52
-
53
-
54
-
55
-
56
-
57
-
58
-
59
-
60
-
61
-
62
-
63
-
64
-
65
-
66
-
67
-
68
-
69
-
70
-
71
-
72
-
73
-
74
-
75
-
76
-
77
-
78
-
79
-
80
-
81
-
 82
82 -
 83
83 -
 84
84 -
 85
85 -
 86
86 -
 87
87 -
 88
88 -
 89
89 -
 90
90 -
 91
91 -
 92
92 -
 93
93 -
 94
94 -
 95
95 -
 96
96 -
 97
97 -
 98
98
 |
 |

90
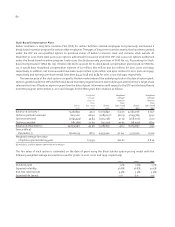
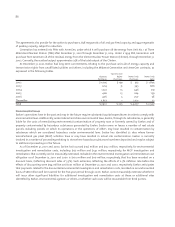
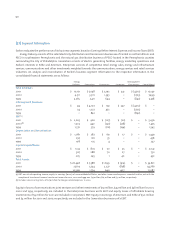
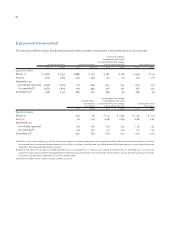
(21) Segment Information
Exelon evaluates the performance of its business segments based on Earnings Before Interest Expense and Income Taxes (EBIT).
Energy Delivery consists of the retail electricity distribution and transmission businesses of ComEd in northern Illinois and
PECO in southeastern Pennsylvania and the natural gas distribution business of PECO located in the Pennsylvania counties
surrounding the City of Philadelphia. Generation consists of electric generating facilities, energy marketing operations and
Exelon’s interests in Sithe and AmerGen. Enterprises consists of competitive retail energy sales, energy and infrastructure
services, communications and other investments weighted towards the communications, energy services and retail services
industries. An analysis and reconciliation of Exelon’s business segment information to the respective information in the
consolidated financial statements are as follows:
Energy Intersegment
Delivery Generation Enterprises Corporate Eliminations Consolidated
Total Revenues:
2001 $ 10,171 $ 7,048 $ 2,292 $ 341 $ (4,712) $ 15,140
2000 4,511 3,316 1,395 – (1,723) 7,499
1999 3,265 2,411 644 – (842) 5,478
Intersegment Revenues:
2001 $ 94 $ 4,102 $ 179 $ 337 $ (4,712) $ –
2000 24 1,227 472 – (1,723) –
1999 – 842 – – (842) –
EBIT(a):
2001 $ 2,623 $ 962 $ (107) $ (22) $ – $ 3,456
2000(b) 1,503 440 (140) (328) – 1,475
1999 1,372 379 (212) (194) – 1,345
Depreciation and Amortization:
2001 $ 1,081 $ 282 $ 69 $ 17 $ – $ 1,449
2000 297 126 35 – – 458
1999 108 125 4 – – 237
Capital Expenditures:
2001 $ 1,133 $ 803 $ 70 $ 35 $ – $ 2,041
2000 367 288 70 27 – 752
1999 205 245 1 40 – 491
Total Assets:
2001 $ 26,448 $ 7,588 $ 1,699 $ (914) $ – $ 34,821
2000 27,613 5,734 2,277 (838) – 34,786
1999 10,306 1,734 640 407 – 13,087
(a) EBIT consists of operating income, equity in earnings (losses) of unconsolidated affiliates, and other income and expenses recorded in other, net with the
exception of investment income. Investment income for 2001, 2000 and 1999 was $47 million, $64 million and $52 million, respectively.
(b) Includes non-recurring items of $276 million for Merger-related expenses in 2000.
Equity in losses of communications joint ventures and other investments of $19 million,$45 million and $38 million for 2001,
2000 and 1999, respectively, are included in the Enterprises business unit’s EBIT and equity losses of affordable housing
investments of $9 million for 2001 are included in Corporate’s EBIT. Equity in earnings of AmerGen and Sithe of $90 million
and $4 million for 2001 and 2000, respectively, are included in the Generation business unit’s EBIT.