ComEd 2001 Annual Report Download - page 34
Download and view the complete annual report
Please find page 34 of the 2001 ComEd annual report below. You can navigate through the pages in the report by either clicking on the pages listed below, or by using the keyword search tool below to find specific information within the annual report.-
 1
1 -
2
-
3
-
4
-
5
-
6
-
7
-
8
-
9
-
10
-
11
-
12
-
13
-
14
-
15
-
16
-
17
-
18
-
19
-
20
-
21
-
22
-
23
-
 24
24 -
 25
25 -
 26
26 -
 27
27 -
 28
28 -
 29
29 -
 30
30 -
 31
31 -
 32
32 -
 33
33 -
 34
34 -
 35
35 -
 36
36 -
 37
37 -
 38
38 -
 39
39 -
 40
40 -
 41
41 -
 42
42 -
 43
43 -
 44
44 -
45
-
46
-
47
-
48
-
49
-
50
-
51
-
52
-
53
-
54
-
55
-
56
-
57
-
58
-
59
-
60
-
61
-
62
-
63
-
64
-
65
-
66
-
67
-
68
-
69
-
70
-
71
-
72
-
73
-
74
-
75
-
76
-
77
-
78
-
79
-
80
-
81
-
82
-
83
-
84
-
85
-
86
-
87
-
88
-
89
-
90
-
91
-
92
-
93
-
94
-
95
-
96
-
97
-
98
 |
 |

32
Year Ended December 31, 2000 Compared To Year Ended December 31,1999
Net Income and Earnings Per Share
Exelon’s net income increased $16 million, or 3% in 2000. Diluted earnings per share were consistent with the prior year
period. Income before extraordinary items and cumulative effect of a change in accounting principle, decreased $41 million,
or 7% in 2000. Diluted earnings per share on the same basis were consistent with the prior period. Earnings per share
increased less than net income because of an increase in the weighted average shares of common stock outstanding as a result
of the issuance of common stock in connection with the Merger, partially offset by the repurchase of common stock with the
proceeds from PECO’s March 1999 and May 2000 stranded cost recovery securitizations.
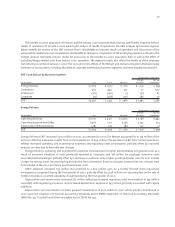
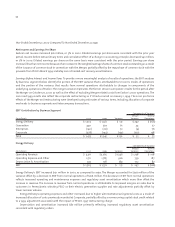
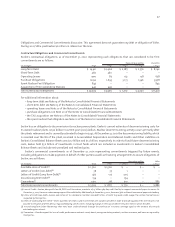
Earnings Before Interest and Income Taxes To provide a more meaningful analysis of results of operations, the EBIT analyses
by business segment below identify the portion of the EBIT variance that is attributable to Unicom’s results of operations
and the portion of the variance that results from normal operations attributable to changes in components of the
underlying operations of Exelon.The merger variance represents the former Unicom companies’ results for the period after
the Merger on October 20, 2000 as well as the effect of excluding Merger-related costs from Exelon’s 2000 operations. The
2000 and 1999 results also reflect the corporate restructuring as if it had occurred on January 1, 1999. The 2000 pro forma
effects of the Merger and restructuring were developed using estimates of various items, including allocation of corporate
overheads to business segments and intercompany transactions.
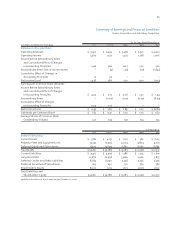
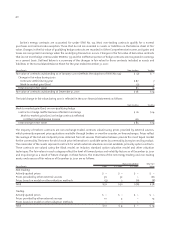
EBIT Contribution by Business Segment
Components of Variance
Merger Normal
(in millions) 2000 1999 Variance Variance Operations
Energy Delivery $ 1,503 $ 1,372 $ 131 $ 297 $ (166)
Generation 440 379 61 34 27
Enterprises (140) (212) 72 (4) 76
Corporate (328) (194) (134) (272) 138
Total $ 1,475 $ 1,345 $ 130 $ 55 $ 75
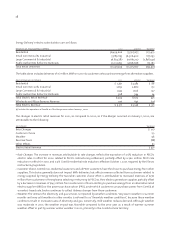
Energy Delivery
Components of Variance
Merger Normal
(in millions) 2000 1999 Variance Variance Operations
Operating Revenue $ 4,511 $3,265 $ 1,246 $ 1,138 $ 108
Operating Expense and Other 2,711 1,785 926 739 187
Depreciation & Amortization 297 108 189 102 87
EBIT $ 1,503 $ 1,372 $ 131 $ 297 $ (166)
Energy Delivery’s EBIT increased $131 million in 2000, as compared to 1999. The Merger accounted for $297 million of the
variance offset by a decrease in EBIT from normal operations of $166 million. The decrease in EBIT from normal operations
reflects increased operating and maintenance expenses and regulatory asset amortization which more than offset the
increase in revenue. The increase in revenue from normal operations is attributable to improved margins on sales due to
customers in Pennsylvania selecting PECO as their electric generation supplier and rate adjustments partially offset by
lower summer volume.
Energy Delivery’s operating expenses and other increased due to higher administrative and general costs as a result of
increased allocation of costs previously recorded at Corporate, partially offset by a nonrecurring capital stock credit related
to a 1999 adjustment associated with the impact of PECO’s 1997 restructuring charge.
Depreciation and amortization increased $87 million primarily reflecting increased regulatory asset amortization
consistent with regulatory orders.