Columbia Sportswear 2000 Annual Report Download - page 49
Download and view the complete annual report
Please find page 49 of the 2000 Columbia Sportswear annual report below. You can navigate through the pages in the report by either clicking on the pages listed below, or by using the keyword search tool below to find specific information within the annual report.-
 1
1 -
2
-
3
-
4
-
5
-
6
-
7
-
8
-
9
-
10
-
11
-
12
-
13
-
14
-
15
-
16
-
17
-
18
-
19
-
20
-
21
-
22
-
23
-
24
-
25
-
26
-
27
-
28
-
29
-
30
-
31
-
32
-
33
-
34
-
35
-
36
-
37
-
38
-
 39
39 -
 40
40 -
 41
41 -
 42
42 -
 43
43 -
 44
44 -
 45
45 -
 46
46 -
 47
47 -
 48
48 -
 49
49 -
 50
50 -
 51
51 -
 52
52 -
 53
53 -
 54
54 -
 55
55 -
 56
56
 |
 |

COLUMBIA SPORTSWEAR COMPANY
NOTES TO CONSOLIDATED FINANCIAL STATEMENTS (Continued)
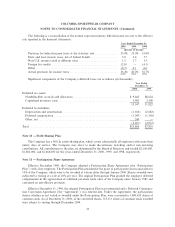
2000 1999 1998
Assets:
United StatesÏÏÏÏÏÏÏÏÏÏÏÏÏÏÏÏÏÏÏÏÏÏÏÏÏÏÏÏÏÏÏÏÏÏÏÏÏÏÏÏÏÏÏÏÏ $351,270 $274,222 $247,125
Canada ÏÏÏÏÏÏÏÏÏÏÏÏÏÏÏÏÏÏÏÏÏÏÏÏÏÏÏÏÏÏÏÏÏÏÏÏÏÏÏÏÏÏÏÏÏÏÏÏÏÏ 31,645 24,905 16,696
Other international ÏÏÏÏÏÏÏÏÏÏÏÏÏÏÏÏÏÏÏÏÏÏÏÏÏÏÏÏÏÏÏÏÏÏÏÏÏÏÏÏ 56,059 45,254 33,571
Total identiÑable assets ÏÏÏÏÏÏÏÏÏÏÏÏÏÏÏÏÏÏÏÏÏÏÏÏÏÏÏÏÏÏÏÏÏÏÏÏ 438,974 344,381 297,392
EliminationsÏÏÏÏÏÏÏÏÏÏÏÏÏÏÏÏÏÏÏÏÏÏÏÏÏÏÏÏÏÏÏÏÏÏÏÏÏÏÏÏÏÏÏÏÏÏ (63,888) (39,391) (27,914)
Total assets ÏÏÏÏÏÏÏÏÏÏÏÏÏÏÏÏÏÏÏÏÏÏÏÏÏÏÏÏÏÏÏÏÏÏÏÏÏÏÏÏ $375,086 $304,990 $269,478
Interest expense (income), net:
United StatesÏÏÏÏÏÏÏÏÏÏÏÏÏÏÏÏÏÏÏÏÏÏÏÏÏÏÏÏÏÏÏÏÏÏÏÏÏÏÏÏÏÏÏÏÏ $ 3,311 $ 4,098 $ 3,340
Canada ÏÏÏÏÏÏÏÏÏÏÏÏÏÏÏÏÏÏÏÏÏÏÏÏÏÏÏÏÏÏÏÏÏÏÏÏÏÏÏÏÏÏÏÏÏÏÏÏÏÏ 565 305 753
Other International ÏÏÏÏÏÏÏÏÏÏÏÏÏÏÏÏÏÏÏÏÏÏÏÏÏÏÏÏÏÏÏÏÏÏÏÏÏÏÏÏ 362 419 (18)
$ 4,238 $ 4,822 $ 4,075
Depreciation and amortization expense:
United StatesÏÏÏÏÏÏÏÏÏÏÏÏÏÏÏÏÏÏÏÏÏÏÏÏÏÏÏÏÏÏÏÏÏÏÏÏÏÏÏÏÏÏÏÏÏ $ 12,384 $ 11,709 $ 6,934
Canada ÏÏÏÏÏÏÏÏÏÏÏÏÏÏÏÏÏÏÏÏÏÏÏÏÏÏÏÏÏÏÏÏÏÏÏÏÏÏÏÏÏÏÏÏÏÏÏÏÏÏ 376 400 392
Other International ÏÏÏÏÏÏÏÏÏÏÏÏÏÏÏÏÏÏÏÏÏÏÏÏÏÏÏÏÏÏÏÏÏÏÏÏÏÏÏÏ 888 495 315
$ 13,648 $ 12,604 $ 7,641
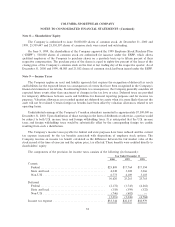
Note 15 Ì Net Income Per Share
SFAS No. 128, ""Earnings Per Share'' requires dual presentation of basic and diluted earnings per share
(""EPS''). Basic EPS is based on the weighted average number of common shares outstanding. Diluted EPS
reÖects the potential dilution that could occur if securities or other contracts to issue common stock were
exercised or converted into common stock.
There were no adjustments to net income in computing diluted earnings per share for the year ended
December 31, 2000, 1999 and 1998. A reconciliation of the common shares used in the denominator for
computing basic and diluted net income per share is as follows (in thousands, except per share amounts):
Year Ended December 31,
2000 1999 1998
Weighted average common shares outstanding, used in computing basic
net income per share ÏÏÏÏÏÏÏÏÏÏÏÏÏÏÏÏÏÏÏÏÏÏÏÏÏÏÏÏÏÏÏÏÏÏÏÏÏÏÏÏÏ 25,694 25,331 23,731
EÅect of dilutive stock options ÏÏÏÏÏÏÏÏÏÏÏÏÏÏÏÏÏÏÏÏÏÏÏÏÏÏÏÏÏÏÏÏÏÏÏ 711 277 327
Weighted-average common shares outstanding, used in computing
diluted net income per share ÏÏÏÏÏÏÏÏÏÏÏÏÏÏÏÏÏÏÏÏÏÏÏÏÏÏÏÏÏÏÏÏÏÏÏ 26,405 25,608 24,058
Net income per share of common stock:
BasicÏÏÏÏÏÏÏÏÏÏÏÏÏÏÏÏÏÏÏÏÏÏÏÏÏÏÏÏÏÏÏÏÏÏÏÏÏÏÏÏÏÏÏÏÏÏÏÏÏÏÏÏÏÏÏ $ 2.28 $ 1.30 $ 1.38
Diluted ÏÏÏÏÏÏÏÏÏÏÏÏÏÏÏÏÏÏÏÏÏÏÏÏÏÏÏÏÏÏÏÏÏÏÏÏÏÏÏÏÏÏÏÏÏÏÏÏÏÏÏÏÏ $ 2.22 $ 1.29 $ 1.36
Note 16 Ì Financial Risk Management and Derivatives
Our foreign currency risk management objective is to protect cash Öows resulting from sales, purchases
and other costs from the impact of exchange rate movements. The Company manages a portion of these
exposures with short-term strategies after giving consideration to market conditions, contractual agreements,
anticipated sale and purchase transactions, and other factors. Firmly committed and anticipated transactions
and the related receivables and payables may be hedged with forward exchange contracts or purchased
options. Premiums paid on purchased options are included in prepaid expenses and are recognized in earnings
37