Columbia Sportswear 2000 Annual Report Download - page 48
Download and view the complete annual report
Please find page 48 of the 2000 Columbia Sportswear annual report below. You can navigate through the pages in the report by either clicking on the pages listed below, or by using the keyword search tool below to find specific information within the annual report.-
 1
1 -
2
-
3
-
4
-
5
-
6
-
7
-
8
-
9
-
10
-
11
-
12
-
13
-
14
-
15
-
16
-
17
-
18
-
19
-
20
-
21
-
22
-
23
-
24
-
25
-
26
-
27
-
28
-
29
-
30
-
31
-
32
-
33
-
34
-
35
-
36
-
37
-
 38
38 -
 39
39 -
 40
40 -
 41
41 -
 42
42 -
 43
43 -
 44
44 -
 45
45 -
 46
46 -
 47
47 -
 48
48 -
 49
49 -
 50
50 -
 51
51 -
 52
52 -
 53
53 -
 54
54 -
 55
55 -
 56
56
 |
 |

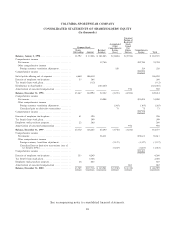
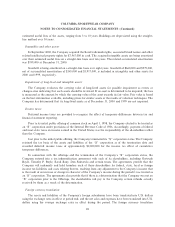
COLUMBIA SPORTSWEAR COMPANY
NOTES TO CONSOLIDATED FINANCIAL STATEMENTS (Continued)
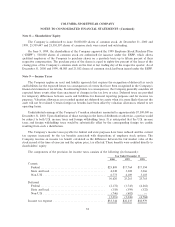
If the Company had accounted for the Plan in accordance with SFAS No. 123, the Company's net
income and earnings per share would approximate the pro forma disclosures below (in thousands, except per
share amounts):
2000 1999 1998
As Reported Proforma As Reported Proforma As Reported Proforma
Net income ÏÏÏÏÏÏÏÏÏÏÏÏÏÏÏÏÏÏÏÏÏÏÏÏ $58,611 $56,435 $33,008 $31,878 $32,744 $32,030
Net income per share Ì basic ÏÏÏÏÏÏÏÏ $ 2.28 $ 2.20 $ 1.30 $ 1.26 $ 1.38 $ 1.35
Net income per share Ì dilutedÏÏÏÏÏÏÏ $ 2.22 $ 2.14 $ 1.29 $ 1.24 $ 1.36 $ 1.33
The eÅects of applying SFAS No. 123 in this pro forma disclosure are not indicative of future amounts.
The following table summarizes information about stock options outstanding at December 31, 2000:
Options Outstanding
Options Exercisable
Weighted Average
Remaining Number of
Range of Number Contractual Weighted Average Shares Weighted Average
Exercise Prices Outstanding Life (yrs) Exercise Price Exercisable Exercise Price
$ 9.68 Ó 14.50 516,838 7.12 $10.93 212,441 $10.53
$ 15.20 Ó 19.63 712,680 8.02 18.64 230,175 18.77
$ 23.56 Ó 27.19 343,014 9.40 26.07 32,119 25.79
$ 34.06 Ó 43.31 10,750 9.87 34.71 24 43.31
$ 9.68 Ó 43.31 1,583,282 8.04 $17.84 474,759 $15.56
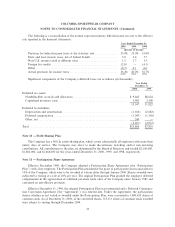
Note 14 Ì Segment Information
The Company operates predominantly in one industry segment: the design, production, marketing and
selling of active outdoor apparel, including outerwear, sportswear, rugged footwear and related accessories.
The geographic distribution of the Company's net sales, income before income tax, identiÑable assets,
interest expense, and depreciation and amortization expense are summarized in the following table (in
thousands) for the years ended December 31, 2000, 1999 and 1998. Inter-geographic net sales, which are
recorded at a negotiated mark-up and eliminated in consolidation, are not material.
2000 1999 1998
Net sales to unrelated entities:
United StatesÏÏÏÏÏÏÏÏÏÏÏÏÏÏÏÏÏÏÏÏÏÏÏÏÏÏÏÏÏÏÏÏÏÏÏÏÏÏÏÏÏÏÏÏÏ $438,854 $341,583 $335,897
Canada ÏÏÏÏÏÏÏÏÏÏÏÏÏÏÏÏÏÏÏÏÏÏÏÏÏÏÏÏÏÏÏÏÏÏÏÏÏÏÏÏÏÏÏÏÏÏÏÏÏÏ 63,117 50,428 38,782
Other International ÏÏÏÏÏÏÏÏÏÏÏÏÏÏÏÏÏÏÏÏÏÏÏÏÏÏÏÏÏÏÏÏÏÏÏÏÏÏÏÏ 112,854 78,492 52,599
$614,825 $470,503 $427,278
Income (loss) before income tax:
United StatesÏÏÏÏÏÏÏÏÏÏÏÏÏÏÏÏÏÏÏÏÏÏÏÏÏÏÏÏÏÏÏÏÏÏÏÏÏÏÏÏÏÏÏÏÏ $ 77,296 $ 50,014 $ 50,132
Canada ÏÏÏÏÏÏÏÏÏÏÏÏÏÏÏÏÏÏÏÏÏÏÏÏÏÏÏÏÏÏÏÏÏÏÏÏÏÏÏÏÏÏÏÏÏÏÏÏÏÏ 11,977 8,074 7,370
Other International ÏÏÏÏÏÏÏÏÏÏÏÏÏÏÏÏÏÏÏÏÏÏÏÏÏÏÏÏÏÏÏÏÏÏÏÏÏÏÏÏ 5,371 3,887 (189)
Less interest and other income (expense) and eliminations ÏÏÏÏÏÏ (2,489) (6,732) (5,590)
$ 92,155 $ 55,243 $ 51,723
36