Cisco 2010 Annual Report Download - page 78
Download and view the complete annual report
Please find page 78 of the 2010 Cisco annual report below. You can navigate through the pages in the report by either clicking on the pages listed below, or by using the keyword search tool below to find specific information within the annual report.-
 1
1 -
2
-
3
-
4
-
5
-
6
-
7
-
8
-
9
-
10
-
11
-
12
-
13
-
14
-
15
-
16
-
17
-
18
-
19
-
20
-
21
-
22
-
23
-
24
-
25
-
26
-
27
-
28
-
29
-
30
-
31
-
32
-
33
-
34
-
35
-
36
-
37
-
38
-
39
-
40
-
41
-
42
-
43
-
44
-
45
-
46
-
47
-
48
-
49
-
50
-
51
-
52
-
53
-
54
-
55
-
56
-
57
-
58
-
59
-
60
-
61
-
62
-
63
-
64
-
65
-
66
-
67
-
 68
68 -
 69
69 -
 70
70 -
 71
71 -
 72
72 -
 73
73 -
 74
74 -
 75
75 -
 76
76 -
 77
77 -
 78
78 -
 79
79 -
 80
80 -
 81
81 -
 82
82 -
 83
83 -
 84
84
 |
 |

Notes to Consolidated Financial Statements
(c) Other Segment Information
The majority of the Company’s assets, excluding cash and cash equivalents and investments, as of July 31, 2010 and July 25, 2009
were attributable to its U.S. operations. The Company’s total cash and cash equivalents and investments held outside of the
United States in various foreign subsidiaries was $33.2 billion and $29.1 billion as of July 31, 2010 and July 25, 2009, respectively,
and the remaining $6.7 billion and $5.9 billion at the respective year ends was held in the United States. In fiscal 2010, 2009, and
2008, no single customer accounted for 10% or more of the Company’s net sales.
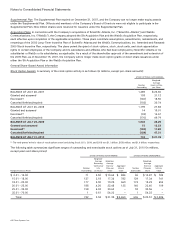
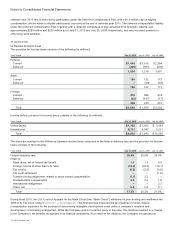
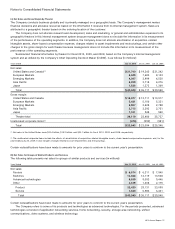
Property and equipment information is based on the physical location of the assets. The following table presents property and
equipment information for geographic areas (in millions):
July 31, 2010 July 25, 2009 July 26, 2008
Property and equipment, net:
United States $ 3,283 $ 3,330 $ 3,478
International 658 713 673
Total $ 3,941 $ 4,043 $ 4,151
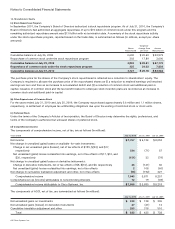
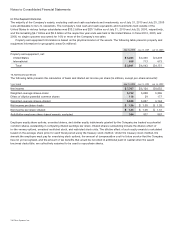
16. Net Income per Share
The following table presents the calculation of basic and diluted net income per share (in millions, except per-share amounts):
Years Ended July 31, 2010 July 25, 2009 July 26, 2008
Net income $ 7,767 $ 6,134 $ 8,052
Weighted-average shares—basic 5,732 5,828 5,986
Effect of dilutive potential common shares 116 29 177
Weighted-average shares—diluted 5,848 5,857 6,163
Net income per share—basic $ 1.36 $ 1.05 $ 1.35
Net income per share—diluted $ 1.33 $ 1.05 $ 1.31
Antidilutive employee share-based awards, excluded 344 977 567
Employee equity share options, unvested shares, and similar equity instruments granted by the Company are treated as potential
common shares outstanding in computing diluted earnings per share. Diluted shares outstanding include the dilutive effect of
in-the-money options, unvested restricted stock, and restricted stock units. The dilutive effect of such equity awards is calculated
based on the average share price for each fiscal period using the treasury stock method. Under the treasury stock method, the
amount the employee must pay for exercising stock options, the amount of compensation cost for future service that the Company
has not yet recognized, and the amount of tax benefits that would be recorded in additional paid-in capital when the award
becomes deductible, are collectively assumed to be used to repurchase shares.
76 Cisco Systems, Inc.