Cisco 2010 Annual Report Download - page 31
Download and view the complete annual report
Please find page 31 of the 2010 Cisco annual report below. You can navigate through the pages in the report by either clicking on the pages listed below, or by using the keyword search tool below to find specific information within the annual report.-
 1
1 -
2
-
3
-
4
-
5
-
6
-
7
-
8
-
9
-
10
-
11
-
12
-
13
-
14
-
15
-
16
-
17
-
18
-
19
-
20
-
 21
21 -
 22
22 -
 23
23 -
 24
24 -
 25
25 -
 26
26 -
 27
27 -
 28
28 -
 29
29 -
 30
30 -
 31
31 -
 32
32 -
 33
33 -
 34
34 -
 35
35 -
 36
36 -
 37
37 -
 38
38 -
 39
39 -
 40
40 -
 41
41 -
42
-
43
-
44
-
45
-
46
-
47
-
48
-
49
-
50
-
51
-
52
-
53
-
54
-
55
-
56
-
57
-
58
-
59
-
60
-
61
-
62
-
63
-
64
-
65
-
66
-
67
-
68
-
69
-
70
-
71
-
72
-
73
-
74
-
75
-
76
-
77
-
78
-
79
-
80
-
81
-
82
-
83
-
84
 |
 |

Management’s Discussion and Analysis of Financial Condition and Results of Operations
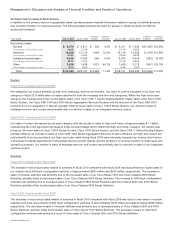
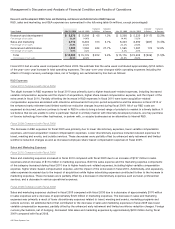
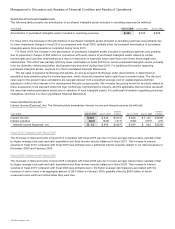
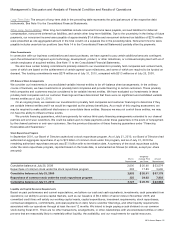
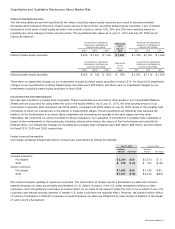
Other Income (Loss), Net The components of other income (loss), net, are summarized as follows (in millions):
Years Ended July 31, 2010 July 25, 2009
Variance
in Dollars July 25, 2009 July 26, 2008
Variance
in Dollars
Net gains on investments in publicly traded equity securities $66 $ 86 $ (20) $ 86 $ 88 $ (2)
Net gains (losses) on investments in fixed income securities 103 (110) 213 (110) 21 (131)
Total net gains (losses) on available-for-sale investments 169 (24) 193 (24) 109 (133)
Net gains (losses) on investments in privately held companies 54 (56) 110 (56) (6) (50)
Net gains (losses) on investments 223 (80) 303 (80) 103 (183)
Other gains (losses), net 16 (48) 64 (48) (114) 66
Other income (loss), net $ 239 $ (128) $ 367 $ (128) $ (11) $ (117)
Fiscal 2010 Compared with Fiscal 2009
For fiscal 2010, the increase in net gains on available-for-sale investments was due to the absence of impairment charges on these
securities during fiscal 2010. For fiscal 2009, the net gains and losses on fixed income securities included impairment charges of
$219 million and net gains on publicly traded equity securities included impairment charges of $39 million. See Note 7 to the
Consolidated Financial Statements for the unrealized gains and losses on investments.
The change in net gains (losses) on investments in privately held companies in fiscal 2010 compared with fiscal 2009 was
primarily due to higher realized gains and lower impairment charges in fiscal 2010. Net losses on investments in privately held
companies included impairment charges of $25 million in fiscal 2010 compared with $85 million in fiscal 2009.
Other gains (losses), net for fiscal 2010 increased due primarily to gains resulting from customer operating lease terminations.
Fiscal 2009 Compared with Fiscal 2008
For fiscal 2009, we had an aggregate net loss on investments in publicly traded equity and fixed income securities recognized in
other income (loss), compared with a net gain in fiscal 2008. The net loss in fiscal 2009 was primarily a result of the volatile market
conditions in the fixed income market during parts of fiscal 2009, which resulted in impairment charges on fixed income securities
of $219 million during fiscal 2009. Net losses on fixed income securities in fiscal 2009 were partially offset by gains on investments
in publicly traded equity securities, which were primarily due to the termination of various forward sale agreements designated as
fair value hedges of publicly traded equity securities. Net gains on publicly traded equity securities include impairment charges of
$39 million during fiscal 2009.
Net losses on investments in privately held companies increased in fiscal 2009 compared with fiscal 2008, primarily as a result
of higher impairment charges, which were due to the deteriorating market conditions during parts of fiscal 2009. Net losses on
investments in privately held companies included impairment charges of $85 million in fiscal 2009 compared with $12 million in
fiscal 2008.
Provision for Income Taxes
Fiscal 2010 Compared with Fiscal 2009
The provision for income taxes resulted in an effective tax rate of 17.5% for fiscal 2010, compared with an effective tax rate of
20.3% for fiscal 2009. During fiscal 2010, the U.S. Court of Appeals for the Ninth Circuit (the “Ninth Circuit”) withdrew its prior
holding and reaffirmed the 2005 U.S. Tax Court ruling in Xilinx, Inc. v. Commissioner. This final decision effectively reversed the
corresponding tax charge in fiscal 2009. The net 2.8 percentage point decrease in the effective tax rate between fiscal years was
primarily attributable to this benefit and the absence in fiscal 2010 of the corresponding charge from fiscal 2009, partially offset by
the absence in fiscal 2010, of the fiscal 2009 tax benefit of $106 million, or 1.4 percentage points, related to the retroactive portion
of the U.S. federal R&D credit reinstatement.
For a full reconciliation of our effective tax rate to the U.S. federal statutory rate of 35% and further explanation of our provision
for income taxes, see Note 14 to the Consolidated Financial Statements.
2010 Annual Report 29