Cisco 2010 Annual Report Download - page 27
Download and view the complete annual report
Please find page 27 of the 2010 Cisco annual report below. You can navigate through the pages in the report by either clicking on the pages listed below, or by using the keyword search tool below to find specific information within the annual report.-
 1
1 -
2
-
3
-
4
-
5
-
6
-
7
-
8
-
9
-
10
-
11
-
12
-
13
-
14
-
15
-
16
-
 17
17 -
 18
18 -
 19
19 -
 20
20 -
 21
21 -
 22
22 -
 23
23 -
 24
24 -
 25
25 -
 26
26 -
 27
27 -
 28
28 -
 29
29 -
 30
30 -
 31
31 -
 32
32 -
 33
33 -
 34
34 -
 35
35 -
 36
36 -
 37
37 -
38
-
39
-
40
-
41
-
42
-
43
-
44
-
45
-
46
-
47
-
48
-
49
-
50
-
51
-
52
-
53
-
54
-
55
-
56
-
57
-
58
-
59
-
60
-
61
-
62
-
63
-
64
-
65
-
66
-
67
-
68
-
69
-
70
-
71
-
72
-
73
-
74
-
75
-
76
-
77
-
78
-
79
-
80
-
81
-
82
-
83
-
84
 |
 |

Management’s Discussion and Analysis of Financial Condition and Results of Operations
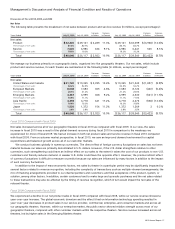
Fiscal 2009 Compared with Fiscal 2008
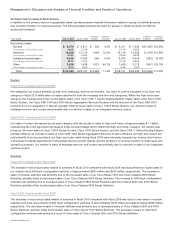
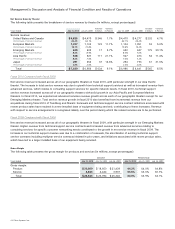
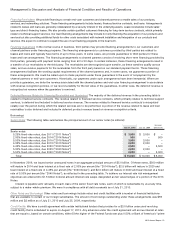
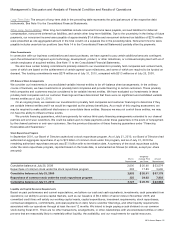
In fiscal 2009, the gross margin percentage increased in our two largest theaters, United States and Canada and European
Markets. For these theaters, the favorable impacts of improved service margins and lower overall manufacturing costs were
partially offset by the effects of lower shipment volume, lower product pricing, and higher sales discounts. The gross margin
percentage also increased in our Japan theater in fiscal 2009, driven by improved service margins and lower overall manufacturing
costs, partially offset by the effect of an unfavorable product mix. The decreases in the gross margin percentages for the Asia
Pacific and Emerging Markets theaters in fiscal 2009 were primarily a result of lower product pricing, higher sales discounts, and
lower shipment volume, partially offset by lower overall manufacturing costs and improved service margins. For the Asia Pacific
theater, the lower product pricing and higher sales discounts effects were attributable to the impact from various market factors,
including price-focused competition in that theater.
Factors That May Impact Net Sales and Gross Margin
Net product sales may continue to be affected by factors including the recent global economic downturn and related market
uncertainty, that have resulted in reduced or cautious spending in our global enterprise, service provider, and commercial markets;
changes in the geopolitical environment and global economic conditions; competition, including price-focused competitors from
Asia, especially from China; new product introductions; sales cycles and product implementation cycles; changes in the mix of our
customers between service provider and enterprise markets; changes in the mix of direct sales and indirect sales; variations in
sales channels; and final acceptance criteria of the product, system, or solution as specified by the customer. Sales to the service
provider market have been and may be in the future characterized by large and sporadic purchases, especially relating to our router
sales and sales of certain advanced technologies. In addition, service provider customers typically have longer implementation
cycles; require a broader range of services, including network design services; and often have acceptance provisions that can lead
to a delay in revenue recognition. Certain of our customers in the Emerging Markets theater also tend to make large and sporadic
purchases, and the net sales related to these transactions may similarly be affected by the timing of revenue recognition. As we
focus on new market opportunities, customers may require greater levels of financing arrangements, service, and support,
especially in the Emerging Markets theater, which may result in a delay in the timing of revenue recognition. To improve customer
satisfaction, we continue to focus on managing our manufacturing lead-time performance, which may result in corresponding
reductions in order backlog. A decline in backlog levels could result in more variability and less predictability in our
quarter-to-quarter net sales and operating results.
Net product sales may also be adversely affected by fluctuations in demand for our products, especially with respect to
telecommunications service providers and Internet businesses, whether or not driven by any slowdown in capital expenditures in
the service provider market; price and product competition in the communications and information technology industry; introduction
and market acceptance of new technologies and products; adoption of new networking standards; and financial difficulties
experienced by our customers. We may, from time to time, experience manufacturing issues that create a delay in our suppliers’
ability to provide specific components, resulting in delayed shipments. To the extent that manufacturing issues and any related
component shortages result in delayed shipments in the future, and particularly in periods when we and our suppliers are operating
at higher levels of capacity, it is possible that revenue for a quarter could be adversely affected if such matters are not remediated
within the same quarter. For additional factors that may impact net product sales, see “Part I, Item 1A. Risk Factors” in our 2010
Annual Report on Form 10-K. Our distributors and retail partners participate in various cooperative marketing and other programs.
In addition, increasing sales to our distributors and retail partners generally result in greater difficulty in forecasting the mix of our
products and, to a certain degree, the timing of orders from our customers. We recognize revenue for sales to our distributors and
retail partners generally based on a sell-through method using information provided by them, and we maintain estimated accruals
and allowances for all cooperative marketing and other programs.
Product gross margin may be adversely affected in the future by changes in the mix of products sold, including further periods
of increased growth of some of our lower margin products; introduction of new products, including products with price-
performance advantages; our ability to reduce production costs; entry into new markets, including markets with different pricing
structures and cost structures, as a result of internal development or through acquisitions; changes in distribution channels; price
competition, including competitors from Asia, especially those from China; changes in geographic mix of our product sales; the
timing of revenue recognition and revenue deferrals; sales discounts; increases in material or labor costs, including share-based
compensation expense; excess inventory and obsolescence charges; warranty costs; changes in shipment volume; loss of cost
savings due to changes in component pricing; effects of value engineering; inventory holding charges; and the extent to which we
successfully execute on our strategy and operating plans. Additionally, our manufacturing-related costs may be negatively
impacted by constraints in our supply chain. Service gross margin may be impacted by various factors such as the change in mix
between technical support services and advanced services, the timing of technical support service contract initiations and
renewals, share-based compensation expense, and the timing of our strategic investments in headcount and resources to support
this business.
2010 Annual Report 25