Cisco 2010 Annual Report Download - page 15
Download and view the complete annual report
Please find page 15 of the 2010 Cisco annual report below. You can navigate through the pages in the report by either clicking on the pages listed below, or by using the keyword search tool below to find specific information within the annual report.-
 1
1 -
2
-
3
-
4
-
 5
5 -
 6
6 -
 7
7 -
 8
8 -
 9
9 -
 10
10 -
 11
11 -
 12
12 -
 13
13 -
 14
14 -
 15
15 -
 16
16 -
 17
17 -
 18
18 -
 19
19 -
 20
20 -
 21
21 -
 22
22 -
 23
23 -
 24
24 -
 25
25 -
26
-
27
-
28
-
29
-
30
-
31
-
32
-
33
-
34
-
35
-
36
-
37
-
38
-
39
-
40
-
41
-
42
-
43
-
44
-
45
-
46
-
47
-
48
-
49
-
50
-
51
-
52
-
53
-
54
-
55
-
56
-
57
-
58
-
59
-
60
-
61
-
62
-
63
-
64
-
65
-
66
-
67
-
68
-
69
-
70
-
71
-
72
-
73
-
74
-
75
-
76
-
77
-
78
-
79
-
80
-
81
-
82
-
83
-
84
 |
 |
Management’s Discussion and Analysis of Financial Condition and Results of Operations
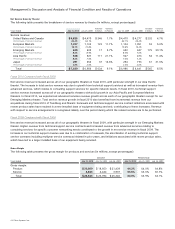
2009 due to improved portfolio management as we moved out of the challenging economic environment in fiscal 2009. Our
allowance percentages for accounts receivable and lease receivables represent a return to approximately the levels we
experienced prior to fiscal 2009, consistent with changes we have observed in the macroeconomic environment.
If a major customer’s creditworthiness deteriorates, or if actual defaults are higher than our historical experience, or if other
circumstances arise, our estimates of the recoverability of amounts due to us could be overstated, and additional allowances could
be required, which could have an adverse impact on our revenue.
A reserve for future sales returns is established based on historical trends in product return rates. The reserve for future sales
returns as of July 31, 2010 and July 25, 2009 was $90 million and $75 million, respectively, and was recorded as a reduction of our
accounts receivable. If the actual future returns were to deviate from the historical data on which the reserve had been established,
our revenue could be adversely affected.
Inventory Valuation and Liability for Purchase Commitments with Contract Manufacturers and Suppliers
Our inventory balance was $1.3 billion and $1.1 billion as of July 31, 2010 and July 25, 2009, respectively. Inventory is written
down based on excess and obsolete inventories determined primarily by future demand forecasts. Inventory write-downs are
measured as the difference between the cost of the inventory and market, based upon assumptions about future demand, and are
charged to the provision for inventory, which is a component of our cost of sales. At the point of the loss recognition, a new, lower
cost basis for that inventory is established, and subsequent changes in facts and circumstances do not result in the restoration or
increase in that newly established cost basis.
We record a liability for firm, noncancelable, and unconditional purchase commitments with contract manufacturers and
suppliers for quantities in excess of our future demand forecasts consistent with the valuation of our excess and obsolete inventory.
As of July 31, 2010, the liability for these purchase commitments was $135 million, compared with $175 million as of July 25,
2009, and was included in other current liabilities.
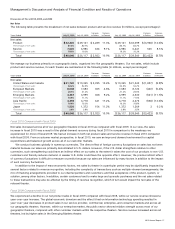
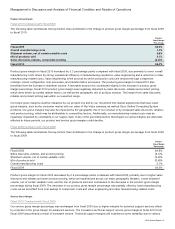
Our provision for inventory was $94 million, $93 million, and $102 million for fiscal 2010, 2009, and 2008, respectively. The
provision for the liability related to purchase commitments with contract manufacturers and suppliers was $8 million, $87 million, and
$97 million in fiscal 2010, 2009, and 2008, respectively. The decrease in the provision for the liability related to purchase commitments
with contract manufacturers and suppliers during fiscal 2010 was primarily attributable to the increase in demand for our products during
fiscal 2010. If there were to be a sudden and significant decrease in demand for our products, or if there were a higher incidence of
inventory obsolescence because of rapidly changing technology and customer requirements, we could be required to increase our
inventory write-downs and our liability for purchase commitments with contract manufacturers and suppliers and gross margin could be
adversely affected. Inventory and supply chain management remain areas of focus as we balance the need to maintain supply chain
flexibility to help ensure competitive lead times with the risk of incurring inventory obsolescence charges.
Warranty Costs
The liability for product warranties, included in other current liabilities, was $360 million as of July 31, 2010, compared with $321
million as of July 25, 2009. See Note 11 to the Consolidated Financial Statements. Our products are generally covered by a
warranty for periods ranging from 90 days to five years, and for some products we provide a limited lifetime warranty. We accrue
for warranty costs as part of our cost of sales based on associated material costs, technical support labor costs, and associated
overhead. Material cost is estimated based primarily upon historical trends in the volume of product returns within the warranty
period and the cost to repair or replace the equipment. Technical support labor cost is estimated based primarily upon historical
trends in the rate of customer cases and the cost to support the customer cases within the warranty period. Overhead cost is
applied based on estimated time to support warranty activities.
The provision for product warranties issued during fiscal 2010, 2009, and 2008 was $469 million, $374 million, and $511
million, respectively. The increase in the provision for product warranties issued during fiscal 2010 was driven primarily by higher
product revenue. If we experience an increase in warranty claims compared with our historical experience, or if the cost of
servicing warranty claims is greater than expected, our gross margin could be adversely affected.
2010 Annual Report 13