Cisco 2010 Annual Report Download - page 14
Download and view the complete annual report
Please find page 14 of the 2010 Cisco annual report below. You can navigate through the pages in the report by either clicking on the pages listed below, or by using the keyword search tool below to find specific information within the annual report.-
 1
1 -
2
-
3
-
 4
4 -
 5
5 -
 6
6 -
 7
7 -
 8
8 -
 9
9 -
 10
10 -
 11
11 -
 12
12 -
 13
13 -
 14
14 -
 15
15 -
 16
16 -
 17
17 -
 18
18 -
 19
19 -
 20
20 -
 21
21 -
 22
22 -
 23
23 -
 24
24 -
25
-
26
-
27
-
28
-
29
-
30
-
31
-
32
-
33
-
34
-
35
-
36
-
37
-
38
-
39
-
40
-
41
-
42
-
43
-
44
-
45
-
46
-
47
-
48
-
49
-
50
-
51
-
52
-
53
-
54
-
55
-
56
-
57
-
58
-
59
-
60
-
61
-
62
-
63
-
64
-
65
-
66
-
67
-
68
-
69
-
70
-
71
-
72
-
73
-
74
-
75
-
76
-
77
-
78
-
79
-
80
-
81
-
82
-
83
-
84
 |
 |

Management’s Discussion and Analysis of Financial Condition and Results of Operations
We elected to early adopt this accounting guidance at the beginning of our first quarter of fiscal 2010 on a prospective basis for
applicable transactions originating or materially modified after July 25, 2009.
The amount of product and service revenue recognized in a given period is affected by our judgment as to whether an
arrangement includes multiple deliverables and, if so, our determinations surrounding whether VSOE exists. In the certain limited
circumstances when VSOE does not exist, we then apply judgment with respect to whether we can obtain TPE. Generally, we are
not able to determine TPE because our go-to-market strategy typically differs from that of our peers. In the limited number of
circumstances in which we are unable to establish selling price using VSOE or TPE, we will use ESP in our allocation of arrangement
consideration. We determine VSOE based on our normal pricing and discounting practices for the specific product or service when
sold separately. In determining VSOE, we require that a substantial majority of the selling prices for a product or service fall within a
reasonably narrow pricing range, generally evidenced by approximately 80% of such historical standalone transactions falling within
plus or minus 15% of the median rates. In determining ESP, we apply significant judgment as we weigh a variety of factors, based
on the facts and circumstances of the arrangement. We typically arrive at an ESP for a product or service that is not sold separately
by considering company-specific factors such as geographies, competitive landscape, internal costs, gross margin objectives,
pricing practices used to establish bundled pricing, and existing portfolio pricing and discounting. There were no material impacts
during fiscal 2010 nor do we currently expect a material impact in future periods from changes in VSOE, TPE, or ESP.
In terms of the timing and pattern of revenue recognition, the new accounting guidance for revenue recognition is not expected
to have a significant effect on net sales in subsequent periods after the initial adoption when applied to multiple-element
arrangements based on current go-to-market strategies due to the existence of VSOE across most of our product and service
offerings. However, we expect that this new accounting guidance will facilitate our efforts to optimize our offerings due to better
alignment between the economics of an arrangement and the accounting. This may lead to us engaging in new go-to-market
practices in the future. In particular, we expect that the new accounting standards will enable us to better integrate products and
services without VSOE into existing offerings and solutions. As these go-to-market strategies evolve, we may modify our pricing
practices in the future, which could result in changes in selling prices, including both VSOE and ESP. As a result, our future revenue
recognition for multiple-element arrangements could differ materially from the results in the current period. We are currently unable
to determine the impact that the newly adopted accounting guidance could have on our revenue as these go-to-market strategies
evolve.
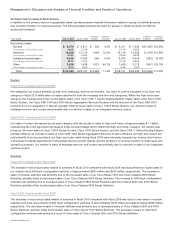
Revenue deferrals relate to the timing of revenue recognition for specific transactions based on financing arrangements,
service, support, and other factors. Financing arrangements may include sales-type, direct-financing, and operating leases, loans,
and guarantees of third-party financing. Our deferred revenue for products was $3.7 billion and $2.9 billion as of July 31, 2010 and
July 25, 2009, respectively. Technical support services revenue is deferred and recognized ratably over the period during which the
services are to be performed, which typically is from one to three years. Advanced services revenue is recognized upon delivery or
completion of performance. Our deferred revenue for services was $7.4 billion and $6.5 billion as of July 31, 2010 and July 25,
2009, respectively.
We make sales to distributors and retail partners and generally recognize revenue based on a sell-through method using
information provided by them. Our distributors and retail partners participate in various cooperative marketing and other programs,
and we maintain estimated accruals and allowances for these programs. If actual credits received by our distributors and retail
partners under these programs were to deviate significantly from our estimates, which are based on historical experience, our
revenue could be adversely affected.
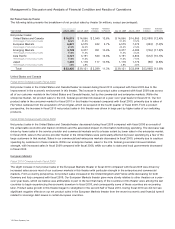
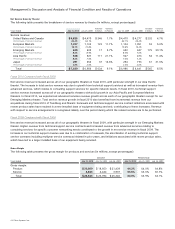
Allowances for Receivables and Sales Returns
The allowances for receivables were as follows (in millions, except percentages):
July 31, 2010 July 25, 2009
Allowance for doubtful accounts $ 235 $ 216
Percentage of gross accounts receivable 4.6% 6.4%
Allowance for lease receivables $ 207 $ 213
Percentage of gross lease receivables 8.6% 10.7%
Allowance for loan receivables $73 $88
Percentage of gross loan receivables 5.8% 10.2%
The allowances are based on our assessment of the collectibility of customer accounts. We regularly review the adequacy of these
allowances by considering factors such as historical experience, credit quality, age of the receivable balances, and economic
conditions that may affect a customer’s ability to pay. In addition, we perform credit reviews and statistical portfolio analysis to
assess the credit quality of our receivables. We also consider the concentration of receivables outstanding with a particular
customer in assessing the adequacy of our allowances. Our allowance percentages declined in fiscal 2010 compared with fiscal
12 Cisco Systems, Inc.