Cisco 2010 Annual Report Download - page 61
Download and view the complete annual report
Please find page 61 of the 2010 Cisco annual report below. You can navigate through the pages in the report by either clicking on the pages listed below, or by using the keyword search tool below to find specific information within the annual report.-
 1
1 -
2
-
3
-
4
-
5
-
6
-
7
-
8
-
9
-
10
-
11
-
12
-
13
-
14
-
15
-
16
-
17
-
18
-
19
-
20
-
21
-
22
-
23
-
24
-
25
-
26
-
27
-
28
-
29
-
30
-
31
-
32
-
33
-
34
-
35
-
36
-
37
-
38
-
39
-
40
-
41
-
42
-
43
-
44
-
45
-
46
-
47
-
48
-
49
-
50
-
 51
51 -
 52
52 -
 53
53 -
 54
54 -
 55
55 -
 56
56 -
 57
57 -
 58
58 -
 59
59 -
 60
60 -
 61
61 -
 62
62 -
 63
63 -
 64
64 -
 65
65 -
 66
66 -
 67
67 -
 68
68 -
 69
69 -
 70
70 -
 71
71 -
72
-
73
-
74
-
75
-
76
-
77
-
78
-
79
-
80
-
81
-
82
-
83
-
84
 |
 |

Notes to Consolidated Financial Statements
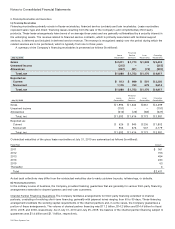
such as actual trade data, benchmark yields, broker/dealer quotes, and other similar data, which are obtained from quoted market
prices, independent pricing vendors, or other sources, to determine the ultimate fair value of these assets and liabilities. The
Company uses such pricing data as the primary inputs to make its assessments and determinations as to the ultimate valuation of
its investment portfolio and has not made, during the periods presented, any material adjustments to such inputs. The Company is
ultimately responsible for the financial statements and underlying estimates. The Company’s derivative instruments are primarily
classified as Level 2, as they are not actively traded and are valued using pricing models that use observable market inputs. The
Company did not have any transfers between Level 1 and Level 2 fair value measurements during fiscal 2010.
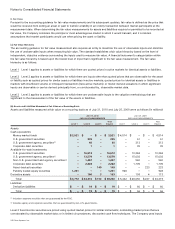
Level 3 assets include asset-backed securities and certain derivative instruments, the values of which are determined based on
discounted cash flow models using inputs that the Company could not corroborate with market data.
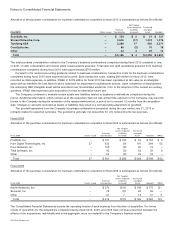
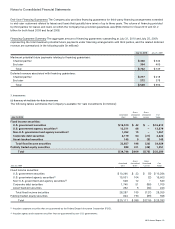
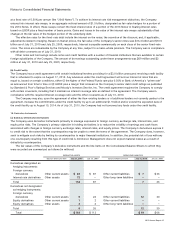
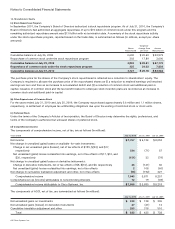
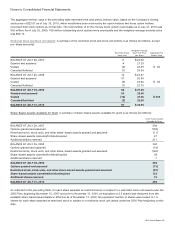
The following tables present a reconciliation for all assets measured at fair value on a recurring basis using significant
unobservable inputs (Level 3) for the years ended July 31, 2010 and July 25, 2009 (in millions):
Asset-Backed
Securities
Derivative
Assets Total
Balance at July 25, 2009 $ 223 $ 4 $ 227
Total gains and losses (realized and unrealized):
Included in other income (loss), net (6) — (6)
Included in operating expenses — (1) (1)
Included in other comprehensive income 34 — 34
Purchases, sales and maturities (102) — (102)
Balance at July 31, 2010 $ 149 $ 3 $ 152
Losses attributable to assets still held as of July 31, 2010 $ — $ (1) $ (1)
Asset-Backed
Securities
Derivative
Assets Total
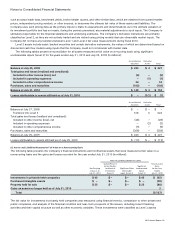
Balance at July 27, 2008 $— $— $—
Transfers into Level 3 618 6 624
Total gains and losses (realized and unrealized):
Included in other income (loss), net (28) — (28)
Included in operating expenses — (2) (2)
Included in other comprehensive income (9) — (9)
Purchases, sales and maturities (358) — (358)
Balance at July 25, 2009 $ 223 $ 4 $ 227
Losses attributable to assets still held as of July 25, 2009 $ (13) $ — $ (13)
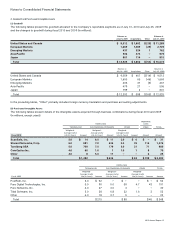
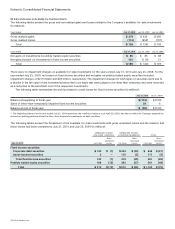
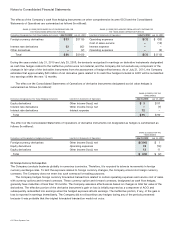
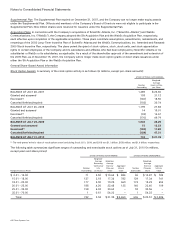
(c) Assets and Liabilities Measured at Fair Value on a Nonrecurring Basis
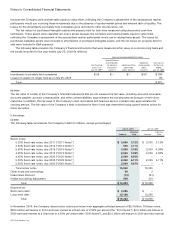
The following table presents the Company’s financial instruments and nonfinancial assets that were measured at fair value on a
nonrecurring basis and the gains and losses recorded for the year ended July 31, 2010 (in millions):
FAIR VALUE MEASUREMENTS USING
Net Carrying
Value as of
July 31, 2010
Quoted Prices in
Active Markets
for Identical
Instruments
(Level 1)
Significant Other
Observable
Inputs (Level 2)
Significant
Unobservable
Inputs
(Level 3)
Total (Losses)
Gains
for the Year
Ended
July 31, 2010
Investments in privately held companies $ 45 $ — $ — $ 45 $ (25)
Purchased intangible assets $ — $ — $ — $ — (28)
Property held for sale $ 25 $ — $ — $ 25 (86)
Gains on assets no longer held as of July 31, 2010 2
Total $ (137)
The fair value for investments in privately held companies was measured using financial metrics, comparison to other private and
public companies, and analysis of the financial condition and near-term prospects of the issuers, including recent financing
activities and their capital structure as well as other economic variables. These investments were classified as Level 3 assets
2010 Annual Report 59