CVS 2000 Annual Report Download - page 41
Download and view the complete annual report
Please find page 41 of the 2000 CVS annual report below. You can navigate through the pages in the report by either clicking on the pages listed below, or by using the keyword search tool below to find specific information within the annual report.-
 1
1 -
2
-
3
-
4
-
5
-
6
-
7
-
8
-
9
-
10
-
11
-
12
-
13
-
14
-
15
-
16
-
17
-
18
-
19
-
20
-
21
-
22
-
23
-
24
-
25
-
26
-
27
-
28
-
29
-
30
-
 31
31 -
 32
32 -
 33
33 -
 34
34 -
 35
35 -
 36
36 -
 37
37 -
 38
38 -
 39
39 -
 40
40 -
 41
41 -
 42
42 -
 43
43 -
 44
44
 |
 |

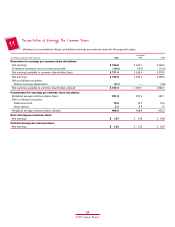
Five-Year Financial Summary
Fiscal Year
2000 1999 1998 1997 1996
In millions, except per share amounts (52 weeks) (53 weeks) (52 weeks) (52 weeks) (52 weeks)
Statement of operations data:
Net sales $ 20,087.5 $ 18,098.3 $ 15,273.6 $ 13,749.6 $ 11,831.6
Gross margin(1) 5,361.7 4,861.4 4,129.2 3,718.3 3,300.9
Selling, general & administrative 3,742.4 3,448.0 2,949.0 2,776.0 2,490.8
Depreciation and amortization 296.6 277.9 249.7 238.2 205.4
Merger, restructuring and other
nonrecurring charges —— 178.6 422.4 12.8
Operating profit(2) 1,322.7 1,135.5 751.9 281.7 591.9
Other expense (income), net 79.3 59.1 60.9 44.1 (51.5)
Income tax provision 497.4 441.3 306.5 149.2 271.0
Earnings from continuing operations
before extraordinary item(3) $ 746.0 $ 635.1 $ 384.5 $ 88.4 $ 372.4
Per common share data:
Earnings from continuing operations
before extraordinary item:(3)
Basic $ 1.87 $ 1.59 $ 0.96 $ 0.20 $ 0.98
Diluted 1.83 1.55 0.95 0.19 0.95
Cash dividends per common share 0.230 0.230 0.225 0.220 0.220
Balance sheet and other data:
Total assets $ 7,949.5 $ 7,275.4 $ 6,686.2 $ 5,920.5 $ 6,014.9
Long-term debt 536.8 558.5 275.7 290.4 1,204.8
Total shareholders’ equity 4,304.6 3,679.7 3,110.6 2,626.5 2,413.8
Number of stores (at end of period) 4,133 4,098 4,122 4,094 4,204
(1) Gross margin includes the pre-tax effect of the following nonrecurring charges: (i) in 1998, $10.0 million ($5.9 million after-tax) related to the markdown of noncompatible Arbor
merchandise and (ii) in 1997, $75.0 million ($49.9 million after-tax) related to the markdown of noncompatible Revco merchandise.
(2) Operating profit includes the pre-tax effect of the charges discussed in Note (1) above and the following merger, restructuring and other nonrecurring charges and gain: (i) in 2000,
$19.2 million ($11.5 million after-tax) nonrecurring gain in total operating expenses, which represented a partial payment of our share of the settlement proceeds from a class action
lawsuit against certain manufacturers of brand name prescription drugs, (ii) in 1998, $147.3 million ($101.3 million after-tax) charge related to the merger of CVS and Arbor and $31.3
million ($18.4 million after-tax) of nonrecurring costs incurred in connection with eliminating Arbor’s information technology systems and Revco’s noncompatible store merchandise
fixtures, (iii) in 1997, $337.1 million ($229.8 million after-tax) charge related to the merger of CVS and Revco on May 29, 1997, $54.3 million ($32.0 million after-tax) of nonrecurring
costs incurred in connection with eliminating Revco’s information technology systems and noncompatible store merchandise fixtures and $31.0 million ($19.1 million after-tax) charge
related to the restructuring of Big B, Inc. and (iv) in 1996, $12.8 million ($6.5 million after-tax) charge related to the write-off of costs incurred in connection with the failed merger of Rite
Aid Corporation and Revco.
(3) Earnings from continuing operations before extraordinary item and earnings per common share from continuing operations before extraordinary item include the after-tax effect of
the charges and gain discussed in Notes (1) and (2) above and a $121.4 million ($72.1 million after-tax) gain realized during 1996 upon the sale of equity securities received as partial
proceeds from the sale of Marshalls during 1995.
39
2000 Annual Report