CVS 2000 Annual Report Download - page 39
Download and view the complete annual report
Please find page 39 of the 2000 CVS annual report below. You can navigate through the pages in the report by either clicking on the pages listed below, or by using the keyword search tool below to find specific information within the annual report.-
 1
1 -
2
-
3
-
4
-
5
-
6
-
7
-
8
-
9
-
10
-
11
-
12
-
13
-
14
-
15
-
16
-
17
-
18
-
19
-
20
-
21
-
22
-
23
-
24
-
25
-
26
-
27
-
28
-
 29
29 -
 30
30 -
 31
31 -
 32
32 -
 33
33 -
 34
34 -
 35
35 -
 36
36 -
 37
37 -
 38
38 -
 39
39 -
 40
40 -
 41
41 -
 42
42 -
 43
43 -
 44
44
 |
 |

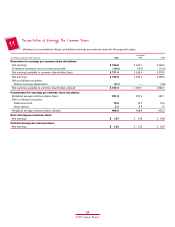
Reconciliation of Earnings Per Common Share
Following is a reconciliation of basic and diluted earnings per common share for the respective years:
Fiscal Year
In millions, except per share amounts 2000 1999 1998
Numerator for earnings per common share calculation:
Net earnings $ 746.0 $ 635.1 $ 384.5
Preference dividends, net of income tax benefit (14.6) (14.7) (13.6)
Net earnings available to common shareholders, basic $ 731.4 $ 620.4 $ 370.9
Net earnings $ 746.0 $ 635.1 $ 384.5
Effect of dilutive securities:
Dilutive earnings adjustments (0.7) — (0.8)
Net earnings available to common shareholders, diluted $ 745.3 $ 635.1 $ 383.7
Denominator for earnings per common share calculation:
Weighted average common shares, basic 391.0 391.3 387.1
Effect of dilutive securities:
Preference stock 10.8 10.7 10.5
Stock options 6.2 6.9 7.6
Weighted average common shares, diluted 408.0 408.9 405.2
Basic earnings per common share:
Net earnings $ 1.87 $ 1.59 $ 0.96
Diluted earnings per common share:
Net earnings $ 1.83 $ 1.55 $ 0.95
11
37
2000 Annual Report