CVS 2000 Annual Report Download - page 3
Download and view the complete annual report
Please find page 3 of the 2000 CVS annual report below. You can navigate through the pages in the report by either clicking on the pages listed below, or by using the keyword search tool below to find specific information within the annual report.-
 1
1 -
 2
2 -
 3
3 -
 4
4 -
 5
5 -
 6
6 -
 7
7 -
 8
8 -
 9
9 -
 10
10 -
 11
11 -
 12
12 -
 13
13 -
 14
14 -
15
-
16
-
17
-
18
-
19
-
20
-
21
-
22
-
23
-
24
-
25
-
26
-
27
-
28
-
29
-
30
-
31
-
32
-
33
-
34
-
35
-
36
-
37
-
38
-
39
-
40
-
41
-
42
-
43
-
44
 |
 |
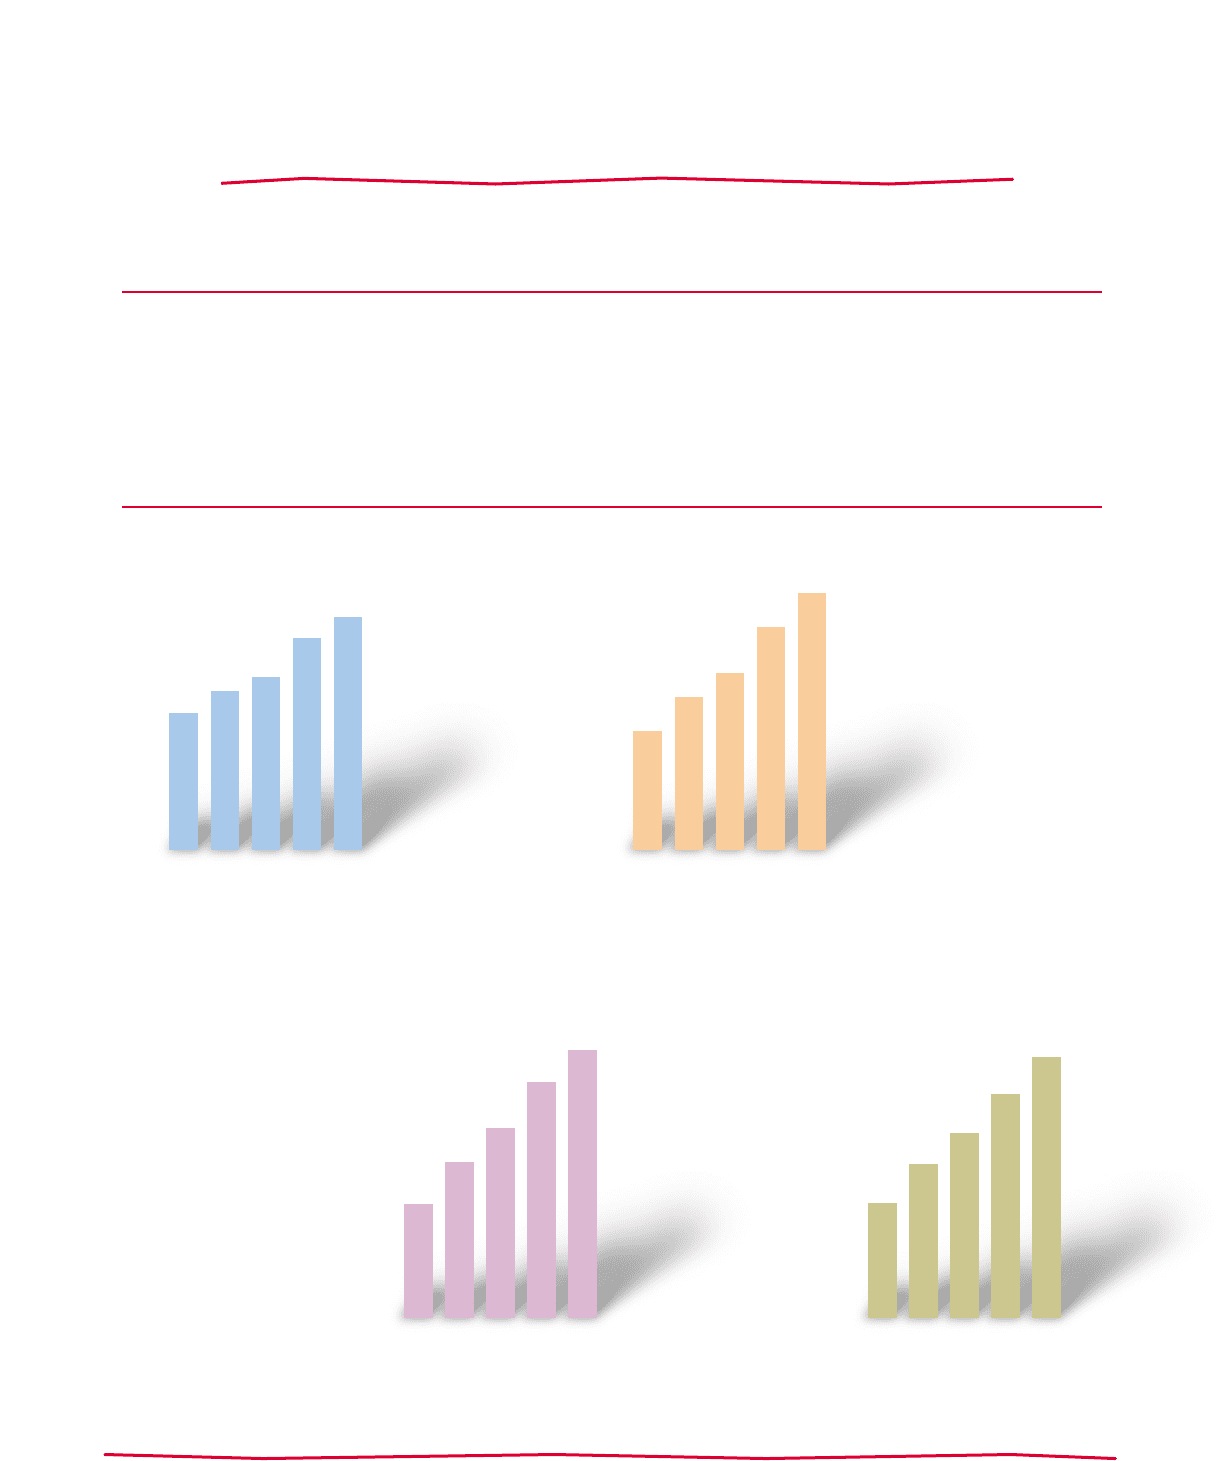
$306.8
$419.2
$510.1
$635.1
$734.5
$0.78
$1.05
$1.26
$1.55
$1.80
$11.8
$13.7
$15.3
$18.1
$20.1
$604.7
$779.1
$940.5
$1,135.5
$1,303.5
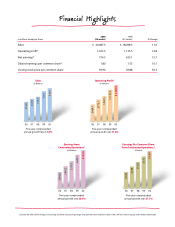
2000 1999
In millions, except per share (52 weeks) (53 weeks) % Change
Sales $ 20,087.5 $ 18,098.3 11.0
Operating profit* 1,303.5 1,135.5 14.8
Net earnings* 734.5 635.1 15.7
Diluted earnings per common share* 1.80 1.55 16.1
Closing stock price per common share 59.94 39.88 50.3
Financial Highlights
* Excludes the effect of the merger, restructuring and other nonrecurring charges and gain that were recorded in 2000, 1998, 1997 and 1996. See page 39 for further information.
Sales
(in Billions)
96 97 98 99 00
Five-year compounded
annual growth rate 13.8%
Operating Profit*
(in Millions)
96 97 98 99 00
Five-year compounded
annual growth rate 21.8%
Earnings from
Continuing Operations*
(in Millions)
96 97 98 99 00
Five-year compounded
annual growth rate 28.4%
Earnings Per Common Share
from Continuing Operations*
(Diluted)
96 97 98 99 00
Five-year compounded
annual growth rate 27.7%