CVS 2000 Annual Report Download - page 31
Download and view the complete annual report
Please find page 31 of the 2000 CVS annual report below. You can navigate through the pages in the report by either clicking on the pages listed below, or by using the keyword search tool below to find specific information within the annual report.-
 1
1 -
2
-
3
-
4
-
5
-
6
-
7
-
8
-
9
-
10
-
11
-
12
-
13
-
14
-
15
-
16
-
17
-
18
-
19
-
20
-
 21
21 -
 22
22 -
 23
23 -
 24
24 -
 25
25 -
 26
26 -
 27
27 -
 28
28 -
 29
29 -
 30
30 -
 31
31 -
 32
32 -
 33
33 -
 34
34 -
 35
35 -
 36
36 -
 37
37 -
 38
38 -
 39
39 -
 40
40 -
 41
41 -
42
-
43
-
44
 |
 |

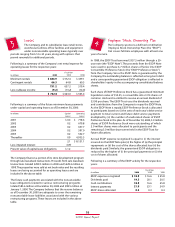
Leases
The Company and its subsidiaries lease retail stores,
warehouse facilities, office facilities and equipment
under noncancelable operating leases typically over
periods ranging from 5 to 25 years, along with options that
permit renewals for additional periods.
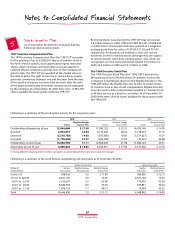
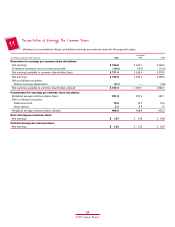
Following is a summary of the Company’s net rental expense for
operating leases for the respective years:
Following is a summary of the future minimum lease payments
under capital and operating leases as of December 30, 2000:
The Company finances a portion of its store development program
through sale-leaseback transactions. Proceeds from sale-leaseback
transactions totaled $299.3 million in 2000 and $229.2 million in
1999.The properties were sold at net book value and the resulting
leases are being accounted for as operating leases and are
included in the above table.
The future cash payments associated with the noncancelable
lease obligations related to various restructuring programs
totaled $83.6 million at December 30, 2000 and $98.5 million at
January 1, 2000.The Company believes that the reserve balances
as of December 30, 2000 are adequate to cover the remaining
noncancelable lease liabilities associated with the various
restructuring programs.These leases are included in the above
table.
Employee Stock Ownership Plan
The Company sponsors a defined contribution
Employee Stock Ownership Plan (the “ESOP”)
that covers full-time employees with at least one
year of service.
In 1989, the ESOP Trust borrowed $357.5 million through a 20-
year note (the “ESOP Note”).The proceeds from the ESOP Note
were used to purchase 6.7 million shares of Series One ESOP
Convertible Preference Stock (the “ESOP Preference Stock”)
from the Company. Since the ESOP Note is guaranteed by the
Company, the outstanding balance is reflected as long-term debt
and a corresponding guaranteed ESOP obligation is reflected in
shareholders’ equity in the accompanying consolidated balance
sheets.
Each share of ESOP Preference Stock has a guaranteed minimum
liquidation value of $53.45, is convertible into 2.314 shares of
common stock and is entitled to receive an annual dividend of
$3.90 per share.The ESOP Trust uses the dividends received
and contributions from the Company to repay the ESOP Note.
As the ESOP Note is repaid, ESOP Preference Stock is allocated
to participants based on: (i) the ratio of each year’s debt service
payment to total current and future debt service payments
multiplied by (ii) the number of unallocated shares of ESOP
Preference Stock in the plan. As of December 30, 2000, 5.0 million
shares of ESOP Preference Stock were outstanding, of which
2.0 million shares were allocated to participants and the
remaining 3.0 million shares were held in the ESOP Trust for
future allocations.
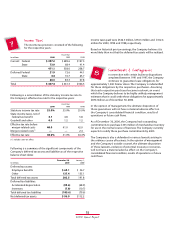
Annual ESOP expense recognized is equal to (i) the interest
incurred on the ESOP Note plus (ii) the higher of (a) the principal
repayments or (b) the cost of the shares allocated, less (iii) the
dividends paid. Similarly, the guaranteed ESOP obligation is
reduced by the higher of (i) the principal payments or (ii) the
cost of shares allocated.
Following is a summary of the ESOP activity for the respective
years:
3
Fiscal Year
In millions 2000 1999 1998
Minimum rentals $ 684.9 $ 572.4 $ 459.1
Contingent rentals 66.3 64.8 60.3
751.2 637.2 519.4
Less: sublease income (9.2) (13.2) (14.0)
$ 742.0 $ 624.0 $ 505.4
In millions Capital Operating
Leases Leases
2001 $ 0.4 $ 718.6
2002 0.2 679.8
2003 0.2 637.7
2004 0.2 597.0
2005 0.2 542.7
Thereafter 0.9 4,955.3
2.1 $ 8,131.1
Less: imputed interest (0.9)
Present value of capital lease obligations $ 1.2
Fiscal Year
In millions 2000 1999 1998
ESOP expense recognized $ 18.8 $ 16.6 $ 25.8
Dividends paid 19.5 20.1 20.5
Cash contributions 18.8 16.6 25.8
Interest payments 21.9 23.1 24.9
ESOP shares allocated 0.3 0.3 0.4
4
29
2000 Annual Report