CVS 2000 Annual Report Download - page 21
Download and view the complete annual report
Please find page 21 of the 2000 CVS annual report below. You can navigate through the pages in the report by either clicking on the pages listed below, or by using the keyword search tool below to find specific information within the annual report.-
 1
1 -
2
-
3
-
4
-
5
-
6
-
7
-
8
-
9
-
10
-
 11
11 -
 12
12 -
 13
13 -
 14
14 -
 15
15 -
 16
16 -
 17
17 -
 18
18 -
 19
19 -
 20
20 -
 21
21 -
 22
22 -
 23
23 -
 24
24 -
 25
25 -
 26
26 -
 27
27 -
 28
28 -
 29
29 -
 30
30 -
 31
31 -
32
-
33
-
34
-
35
-
36
-
37
-
38
-
39
-
40
-
41
-
42
-
43
-
44
 |
 |

•Sales to customers covered by third party insurance programs
have continued to increase and, thus, have become a larger
part of our total pharmacy business. On average, our gross
margin on third party pharmacy sales is lower than our gross
margin on cash pharmacy sales.
• Our third party gross margin rates have historically reflected
varying degrees of pressure due to the efforts of managed
care organizations and other pharmacy benefit managers
to reduce prescription drug costs.To address this trend, we
have dropped and/or renegotiated a number of third party
programs that fell below our minimum profitability
standards.These continuing efforts have resulted in a
stabilization of third party rates. However, in the event this
trend were to continue and we elect to drop additional
programs and/or decide not to participate in future
programs that fall below our minimum profitability
standards, we may not be able to sustain our current rate of
sales growth.
Total operating expenses were 20.1% of net sales in 2000. This
compares to 20.6% of net sales in 1999 and 22.1% in 1998. As
you review our performance in this area, please remember to
consider the impact of the following nonrecurring gain and charge:
•During 2000, we recorded a $19.2 million pre-tax ($11.5
million after-tax) nonrecurring gain in total operating
expenses, which represented a partial payment of our share
of the settlement proceeds from a class action lawsuit
against certain manufacturers of brand name prescription
drugs.The timing and amount of any future payments have
yet to be determined.
•During 1998, we recorded a $147.3 million pre-tax ($101.3
million after-tax) charge in total operating expenses for
direct and other merger-related costs pertaining to the
CVS/Arbor merger transaction and related restructuring
activities. In addition, we incurred $31.3 million of
nonrecurring costs ($18.4 million after-tax) in connection
with eliminating Arbor’s information technology systems
and Revco’s noncompatible store merchandise fixtures.
Please read Note 10 to the consolidated financial statements
for other important information about the CVS/Arbor merger.
If you exclude the effect of the nonrecurring gain and charges
we recorded in 2000 and 1998, respectively, comparable total
operating expenses as a percentage of net sales were 20.2% in
2000, 20.6% in 1999 and 20.9% in 1998.
What have we done to improve our comparable total operating
expenses as a percentage of net sales?
•Our strong sales performance has consistently allowed our
net sales to grow at a faster pace than total operating
expenses.
•Our information technology initiatives have led to greater
productivity, which has resulted in lower operating costs,
particularly at the store level.
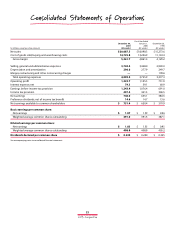
Operating profit increased $187.2 million in 2000 to $1.3 billion.
This compares to $1.1 billion in 1999 and $751.9 million in 1998.
If you exclude the effect of the nonrecurring gain we recorded in
total operating expenses in 2000 and the nonrecurring charges
we recorded in gross margin and in total operating expenses in
1998, our comparable operating profit increased $168.0 million
in 2000 to $1.3 billion (or 14.8%).This compares to $1.1 billion in
1999 and $940.5 million in 1998. Comparable operating profit as
a percentage of net sales was 6.5% in 2000, 6.3% in 1999 and 6.2%
in 1998.
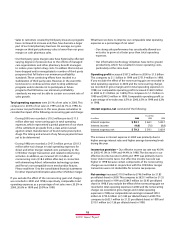
Interest expense, net consisted of the following:
The increase in interest expense in 2000 was primarily due to
higher average interest rates and higher average borrowing levels
during the year.
Income tax provision ~ Our effective income tax rate was 40.0%
in 2000, 41.0% in 1999 and 44.4% in 1998. The decrease in our
effective income tax rate in 2000 and 1999 was primarily due to
lower state income taxes. Our effective income tax rate was
higher in 1998 because certain components of the nonrecurring
charges we recorded in conjunction with the CVS/Arbor merger
transaction were not deductible for income tax purposes.
Net earnings increased $110.9 million to $746.0 million (or $1.83
per diluted share) in 2000.This compares to $635.1 million (or $1.55
per diluted share) in 1999 and $384.5 million (or $0.95 per diluted
share) in 1998. If you exclude the effect of the nonrecurring gain we
recorded in total operating expenses in 2000 and the nonrecurring
charges we recorded in gross margin and in total operating
expenses in 1998, our comparable net earnings increased $99.4
million to $734.5 million (or $1.80 per diluted share) in 2000.This
compares to $635.1 million (or $1.55 per diluted share) in 1999 and
$510.1 million (or $1.26 per diluted share) in 1998.
Fiscal Year
In millions 2000 1999 1998
Interest expense $ 84.1 $ 66.1 $ 69.7
Interest income (4.8) (7.0) (8.8)
Interest expense, net $ 79.3 $ 59.1 $ 60.9
19
2000 Annual Report