Best Buy 2000 Annual Report Download - page 33
Download and view the complete annual report
Please find page 33 of the 2000 Best Buy annual report below. You can navigate through the pages in the report by either clicking on the pages listed below, or by using the keyword search tool below to find specific information within the annual report.-
 1
1 -
2
-
3
-
4
-
5
-
6
-
7
-
8
-
9
-
10
-
11
-
12
-
13
-
14
-
15
-
16
-
17
-
18
-
19
-
20
-
21
-
22
-
 23
23 -
 24
24 -
 25
25 -
 26
26 -
 27
27 -
 28
28 -
 29
29 -
 30
30 -
 31
31 -
 32
32 -
 33
33 -
 34
34 -
 35
35 -
 36
36 -
 37
37 -
 38
38 -
 39
39 -
 40
40 -
 41
41 -
 42
42 -
 43
43 -
44
-
45
-
46
-
47
-
48
-
49
-
50
-
51
-
52
 |
 |

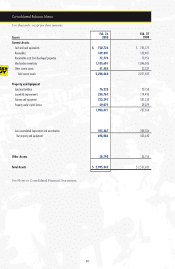
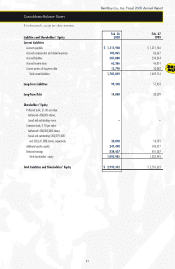
31
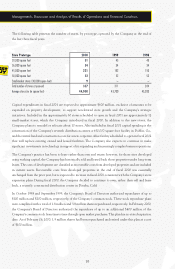
$ in thousands, except per share amounts
Best Buy Co., Inc. Fiscal 2000 Annual Report
Feb. 26 Feb. 27
Liabilities and Shareholders’ Equity 2000 1999
Current Liabilities
Accounts payable $ 1,313,940 $ 1,011,746
Accrued compensation and related expenses 102,065 86,667
Accrued liabilities 287,888 234,364
Accrued income taxes 65,366 46,851
Current portion of long-term debt 15,790 30,088
Total current liabilities 1,785,049 1,409,716
Long-Term Liabilities 99,448 57,453
Long-Term Debt 14,860 30,509
Shareholders’ Equity
Preferred stock, $1.00 par value:
Authorized–400,000 shares;
Issued and outstanding–none ––
Common stock, $.10 par value:
Authorized–400,000,000 shares;
Issued and outstanding–200,379,000
and 203,621,000 shares, respectively 20,038 10,181
Additional paid-in capital 247,490 542,377
Retained earnings 828,457 481,387
Total shareholders’ equity 1,095,985 1,033,945
Total Liabilities and Shareholders’ Equity $ 2,995,342 $ 2,531,623
Consolidated Balance Sheets