Best Buy 2000 Annual Report Download - page 26
Download and view the complete annual report
Please find page 26 of the 2000 Best Buy annual report below. You can navigate through the pages in the report by either clicking on the pages listed below, or by using the keyword search tool below to find specific information within the annual report.-
 1
1 -
2
-
3
-
4
-
5
-
6
-
7
-
8
-
9
-
10
-
11
-
12
-
13
-
14
-
15
-
 16
16 -
 17
17 -
 18
18 -
 19
19 -
 20
20 -
 21
21 -
 22
22 -
 23
23 -
 24
24 -
 25
25 -
 26
26 -
 27
27 -
 28
28 -
 29
29 -
 30
30 -
 31
31 -
 32
32 -
 33
33 -
 34
34 -
 35
35 -
 36
36 -
37
-
38
-
39
-
40
-
41
-
42
-
43
-
44
-
45
-
46
-
47
-
48
-
49
-
50
-
51
-
52
 |
 |

24
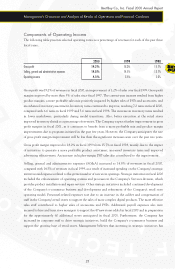
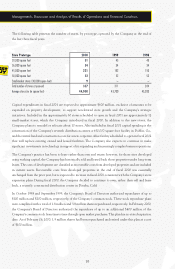
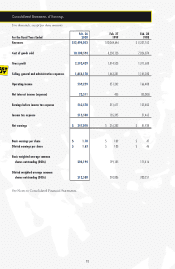
benefited the Company’s operating model and has contributed to gross profit margin gains. SG&A as a
percentage of gross margin, one measure of the return on the investment in SG&A, improved to 77%
in fiscal 2000 compared with 81% in fiscal 1999. The returns on the increased investment in SG&A are
also reflected in the improvement in operating income to 4.3% of revenues in fiscal 2000, from 3.5% in
fiscal 1999.
The Company plans to continue to invest in strategic initiatives to improve profitability and increase
shareholder value. Spending will likely increase as the Company incurs the costs associated with the further
expansion of its retail store network, including entry into the metropolitan New York market. Higher SG&A
spending also is expected due to the launch of the Company’s expanded e-commerce business and related
marketing expenses to generate awareness and drive customer traffic. The Company also will continue to
invest in new information systems, its Services division and inventory management systems. Management
expects the investment in SG&A will continue to be funded by the anticipated increase in gross profit margin.
The increase in SG&A as a percent of sales in fiscal 1999 compared with fiscal 1998 was due primarily to
higher levels of compensation and professional services. Compensation increased due to a competitive
labor market, a full year of the dedicated area in the retail stores designed to support sales of more complex
products and expenses associated with an increased number of store openings. Additionally, professional
service expenses were incurred for initiatives to improve operating performance and implement business
process improvements, in addition to addressing Year 2000 system issues.
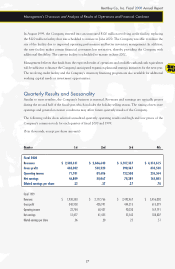
Net interest income improved nearly $23 million in fiscal 2000, as compared with fiscal 1999, due to higher
cash balances, higher interest rates and lower levels of debt. Faster inventory turns and increased profitability
enabled the Company to maintain its cash balances even with the repurchase of nearly $400 million of
common stock in fiscal 2000.
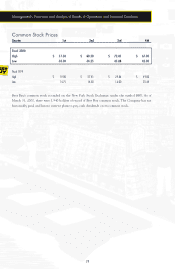
The Company’s effective income tax rate in fiscal 2000 was 38.3%, down slightly from 38.5% in fiscal 1999
and 38.6% in fiscal 1998. The Company’s effective tax rate is impacted by changes in the taxability of
investment income and state income tax rates.
Subsequent to year-end, the Company finalized a comprehensive strategic alliance with Microsoft Corp.
The agreement encompasses significant co-marketing between the Microsoft Network of Internet Services
(MSN™), BestBuy.com and Best Buy’s retail stores, via direct marketing and advertising inserts. Microsoft
will support BestBuy.com with prominent placement across Microsoft properties, including MSNBC,
WebTV Network,™ the Expedia.com™ travel service, MSN Hotmail™ Web-based e-mail service and the
MSN eShop online shopping service. In addition to Microsoft providing marketing and technology support
to Best Buy, the agreement provides mutual financial benefits for both companies. In connection with the
alliance, Microsoft purchased 3.9 million shares of Best Buy common stock for $200 million.
Management’s Discussion and Analysis of Results of Operations and Financial Condition