Best Buy 2000 Annual Report Download - page 20
Download and view the complete annual report
Please find page 20 of the 2000 Best Buy annual report below. You can navigate through the pages in the report by either clicking on the pages listed below, or by using the keyword search tool below to find specific information within the annual report.-
 1
1 -
2
-
3
-
4
-
5
-
6
-
7
-
8
-
9
-
 10
10 -
 11
11 -
 12
12 -
 13
13 -
 14
14 -
 15
15 -
 16
16 -
 17
17 -
 18
18 -
 19
19 -
 20
20 -
 21
21 -
 22
22 -
 23
23 -
 24
24 -
 25
25 -
 26
26 -
 27
27 -
 28
28 -
 29
29 -
 30
30 -
31
-
32
-
33
-
34
-
35
-
36
-
37
-
38
-
39
-
40
-
41
-
42
-
43
-
44
-
45
-
46
-
47
-
48
-
49
-
50
-
51
-
52
 |
 |

18
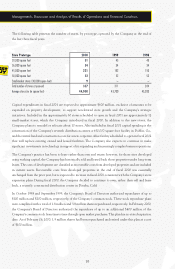
$ in thousands, except per share amounts
Fiscal Period(1) 2000 1999(6) 1998(6) 1997(6)
Statement of Earnings Data
Revenues $ 12,494,023 $ 10,064,646 $ 8,337,762 $ 7,757,692
Gross profit 2,393,429 1,814,523 1,311,688 1,045,890
Selling, general and administrative expenses 1,854,170 1,463,281 1,145,280 1,005,675
Operating income 539,259 351,242 166,408 40,215
Earnings (loss) before cumulative effect
of accounting change 347,070 216,282 81,938 (6,177)
Net earnings (loss) 347,070 216,282 81,938 (6,177)
Per Share Data(2)
Earnings (loss) before cumulative effect
of accounting change $ 1.63 $ 1.03 $ .46 $ (.04)
Net earnings (loss) 1.63 1.03 .46 (.04)
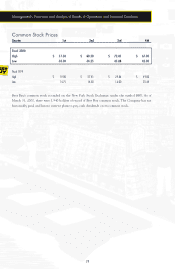
Common stock price: High 80.50 49.00 15.30 6.56
Low 40.50 14.75 2.16 1.97
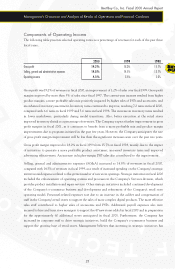
Operating and Other Data
Comparable store sales change(3) 11.1% 13.5% 2.0% (4.7%)
Number of stores (year-end) 357 311 284 272
Average revenues per store(4) $ 37,200 $ 33,700 $ 29,600 $ 29,300
Gross profit percentage 19.2% 18.0% 15.7% 13.5%
Selling, general and administrative expense
percentage 14.8% 14.5% 13.7% 13.0%
Operating income percentage 4.3% 3.5% 2.0% .5%
Inventory turns(5) 7.2 6.6 5.6 4.6
Year-End Balance Sheet Data
Working capital $ 453,411 $ 662,111 $ 666,172 $ 563,083
Total assets 2,995,342 2,531,623 2,070,371 1,740,399
Long-term debt, including current portion 30,650 60,597 225,322 238,016
Convertible preferred securities –– 229,854 230,000
Shareholders’ equity 1,095,985 1,033,945 535,712 428,796
This table should be read in conjunction with Management’s Discussion and
Analysis of Results of Operations and Financial Condition, beginning on page 20,
and the Consolidated Financial Statements and Notes, beginning on page 30.
(1) Fiscal 1996contained 53weeks. All other periods presented contained52 weeks.
(2) Earnings per share is presented on a diluted basis and reflects two-for-one
stock splits in March 1999, May 1998 and April 1994, and a three-for-two stock
split in September 1993.
(3) Comparable stores are stores open at least 14 full months.
(4) Average revenues per store is based upon total revenues for the period divided
by the weighted average number of stores open during such period.
(5) Inventory turns are calculated based upon a monthly average of inventory
balances.
(6) During fiscal 2000, to comply with guidance from the staff of the Securities
and Exchange Commission, the Company changed its accounting policy with
respect to the recognition of net commission revenues from the sale of certain
insured extended service contracts sold after November 1995. This change
resulted in a restatement of previously reported financial information.
(7) During fiscal 1994, the Company adopted SFAS No. 109, Accounting for
Income Taxes, resulting in a cumulative effect adjustment of ($425) or ($.01)
per share.
(8) During fiscal 1991,the Company changed its method of accounting for extended
service contracts, resulting in a cumulative effect adjustment of ($13,997) or
($.15) per share.
10 -Year Financial Highlights