Best Buy 2000 Annual Report Download - page 29
Download and view the complete annual report
Please find page 29 of the 2000 Best Buy annual report below. You can navigate through the pages in the report by either clicking on the pages listed below, or by using the keyword search tool below to find specific information within the annual report.-
 1
1 -
2
-
3
-
4
-
5
-
6
-
7
-
8
-
9
-
10
-
11
-
12
-
13
-
14
-
15
-
16
-
17
-
18
-
 19
19 -
 20
20 -
 21
21 -
 22
22 -
 23
23 -
 24
24 -
 25
25 -
 26
26 -
 27
27 -
 28
28 -
 29
29 -
 30
30 -
 31
31 -
 32
32 -
 33
33 -
 34
34 -
 35
35 -
 36
36 -
 37
37 -
 38
38 -
 39
39 -
40
-
41
-
42
-
43
-
44
-
45
-
46
-
47
-
48
-
49
-
50
-
51
-
52
 |
 |

27
Best Buy Co., Inc. Fiscal 2000 Annual Report
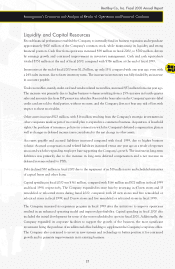
In August 1999, the Company entered into an unsecured $100 million revolving credit facility, replacing
the $220 million facility that was scheduled to mature in June 2000. The Company was able to reduce the
size of the facility due to improved operating performance and better inventory management. In addition,
the new facility makes certain financial covenants less restrictive, thereby providing the Company with
additional flexibility. The current facility is scheduled to mature in June 2002.
Management believes that funds from the expected results of operations and available cash and cash equivalents
will be sufficient to finance the Company’s anticipated expansion plans and strategic initiatives for the next year.
The revolving credit facility and the Company’s inventory financing program are also available for additional
working capital needs or investment opportunities.
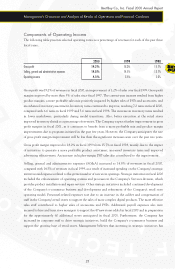
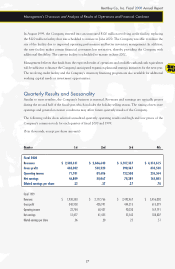
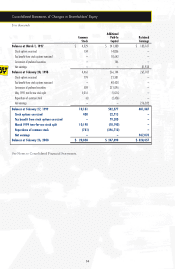
Quarterly Results and Seasonality
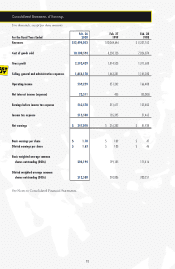
Similar to most retailers, the Company’s business is seasonal. Revenues and earnings are typically greater
during the second half of the fiscal year, which includes the holiday selling season. The timing of new store
openings and general economic conditions may affect future quarterly results of the Company.
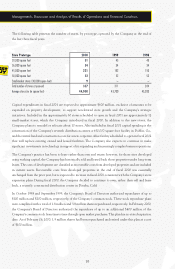
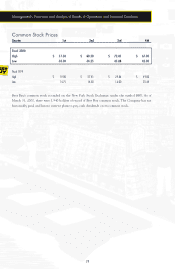
The following tables show selected unaudited quarterly operating results and high and low prices of the
Company’s common stock for each quarter of fiscal 2000 and 1999.
($ in thousands, except per share amounts)
Quarter 1st 2nd 3rd 4th
Fiscal 2000
Revenues $ 2,385,431 $ 2,686,640 $ 3,107,337 $ 4,314,615
Gross profit 462,002 530,520 590,367 810,540
Operating income 71,701 89,606 122,588 255,364
Net earnings 46,809 58,067 78,389 163,805
Diluted earnings per share .22 .27 .37 .78
Fiscal 1999
Revenues $ 1,938,383 $ 2,177,766 $ 2,492,467 $ 3,456,030
Gross profit 348,938 405,991 444,215 615,379
Operating income 22,784 68,437 90,230 169,791
Net earnings 12,477 41,455 53,543 108,807
Diluted earnings per share .06 .20 .25 .51
Management’s Discussion and Analysis of Results of Operations and Financial Condition