Best Buy 2000 Annual Report Download - page 23
Download and view the complete annual report
Please find page 23 of the 2000 Best Buy annual report below. You can navigate through the pages in the report by either clicking on the pages listed below, or by using the keyword search tool below to find specific information within the annual report.-
 1
1 -
2
-
3
-
4
-
5
-
6
-
7
-
8
-
9
-
10
-
11
-
12
-
 13
13 -
 14
14 -
 15
15 -
 16
16 -
 17
17 -
 18
18 -
 19
19 -
 20
20 -
 21
21 -
 22
22 -
 23
23 -
 24
24 -
 25
25 -
 26
26 -
 27
27 -
 28
28 -
 29
29 -
 30
30 -
 31
31 -
 32
32 -
 33
33 -
34
-
35
-
36
-
37
-
38
-
39
-
40
-
41
-
42
-
43
-
44
-
45
-
46
-
47
-
48
-
49
-
50
-
51
-
52
 |
 |

21
Best Buy Co., Inc. Fiscal 2000 Annual Report
The Company opened 47 new stores in fiscal 2000, including entry into the markets of San Francisco,
Sacramento and San Diego, Calif.; Norfolk and Richmond,Va.; Albany and Rochester, N.Y.; and Jacksonville
and Tallahassee, Fla. Included in the 47 new stores were nine of the Company’s new small-market stores,
intended to serve markets with populations less than 200,000. The Company also relocated 10 stores,
expanded three stores and closed one store in fiscal 2000.
Revenues in fiscal 1999 were 20.7% higher than the $8.3 billion reported in fiscal 1998, as comparable store
sales increased 13.5%, 28 new stores were added and results included a full year of operation at the 13 stores
opened in fiscal 1998. The comparable store sales gains last year also were driven by strong consumer spending,
market share gains and improvements in the Company’s operating model. Increased affordability of products,
including personal computers and consumer electronics, contributed to the sales increase along with strong
consumer response to new digital technology. More effective advertising, a better product assortment and
improved in-stock positions, as well as the continued consolidation and closing of competing retailers,
drove the market share gains in fiscal 1999.
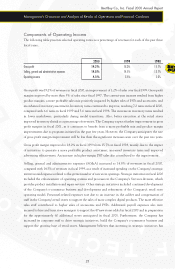
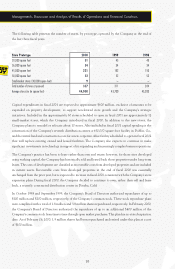
Product Category Performance
The following table presents the Company’s retail store sales mix by major product category for each of the
past three fiscal years.
2000 1999 1998
Home Office 35% 36% 38%
Consumer Electronics–Video 17% 16% 15%
Consumer Electronics–Audio 11% 11% 11%
Entertainment Software 19% 20% 20%
Appliances 8% 8% 9%
Other 10% 9% 7%
Total 100% 100% 100%
The Company’s sales in the home office product category continued to expand in fiscal 2000, although the
growth was outpaced by gains in other product categories. As a result, the home office category declined to
35% of total sales in fiscal 2000, from 36% in fiscal 1999 and 38% in fiscal 1998. ISP subsidy offers stimulated
unit sales of personal computers, which more than offset a decline in average selling prices of approximately
20%. Selling prices of personal computers below $500, after ISP rebates, and the increasing popularity of
the Internet, attracted new as well as repeat buyers. Improved merchandising and selling strategies enabled
the Company to capitalize on the higher unit sales of personal computers and increase sales of additional
higher-margin products and services, such as PSPs and accessories that complement the sale of computer
hardware. Additionally, more effective management of the transition to new computer models led to a
product offering that better satisfied consumer demand and reduced margin pressure at the end of product
life cycles. Consumers also rapidly embraced a popular assortment of new digital communication devices
such as digital Web phones, pagers and other new technology products, further driving sales increases in
this category.
Management’s Discussion and Analysis of Results of Operations and Financial Condition