Best Buy 2000 Annual Report Download - page 21
Download and view the complete annual report
Please find page 21 of the 2000 Best Buy annual report below. You can navigate through the pages in the report by either clicking on the pages listed below, or by using the keyword search tool below to find specific information within the annual report.-
 1
1 -
2
-
3
-
4
-
5
-
6
-
7
-
8
-
9
-
10
-
 11
11 -
 12
12 -
 13
13 -
 14
14 -
 15
15 -
 16
16 -
 17
17 -
 18
18 -
 19
19 -
 20
20 -
 21
21 -
 22
22 -
 23
23 -
 24
24 -
 25
25 -
 26
26 -
 27
27 -
 28
28 -
 29
29 -
 30
30 -
 31
31 -
32
-
33
-
34
-
35
-
36
-
37
-
38
-
39
-
40
-
41
-
42
-
43
-
44
-
45
-
46
-
47
-
48
-
49
-
50
-
51
-
52
 |
 |

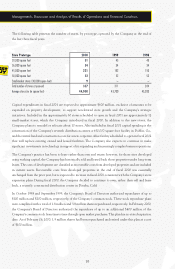
19
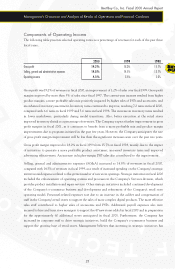
$ in thousands, except per share amounts
Best Buy Co., Inc. Fiscal 2000 Annual Report
1996(6) 1995 1994(7) 1993 1992 1991(8)
$ 7,214,828 $ 5,079,557 $ 3,006,534 $ 1,619,978 $ 929,692 $ 664,823
933,951 690,393 456,925 284,034 181,062 141,657
813,988 568,466 379,747 248,126 162,286 130,681
119,963 121,927 77,178 35,908 18,776 10,976
46,425 57,651 41,710 19,855 9,601 4,540
46,425 57,651 41,285 19,855 9,601 (9,457)
$ .27 $ .32 $ .26 $ .14 $ .08 $ .05
.27 .32 .25 .14 .08 (.10)
7.41 11.31 7.86 3.92 2.95 .92
3.19 5.53 2.72 1.17 .67 .38
5.5% 19.9% 26.9% 19.4% 14.0% 1.0%
251 204 151 111 73 56
$ 31,100 $ 28,400 $ 22,600 $ 17,600 $ 14,300 $ 12,400
12.9% 13.6% 15.2% 17.5% 19.5% 21.3%
11.3% 11.2% 12.6% 15.3% 17.5% 19.7%
1.7% 2.4% 2.6% 2.2% 2.0% 1.6%
4.8 4.7 5.0 4.8 5.1 4.5
$ 584,769 $ 609,049 $ 362,582 $ 118,921 $ 126,817 $ 64,623
1,891,858 1,507,125 952,494 439,142 337,218 185,528
229,855 240,965 219,710 53,870 52,980 35,695
230,000 230,000––––
430,020 376,122 311,444 182,283 157,568 56,741
10 -Year Financial Highlights