Best Buy 2000 Annual Report Download - page 27
Download and view the complete annual report
Please find page 27 of the 2000 Best Buy annual report below. You can navigate through the pages in the report by either clicking on the pages listed below, or by using the keyword search tool below to find specific information within the annual report.-
 1
1 -
2
-
3
-
4
-
5
-
6
-
7
-
8
-
9
-
10
-
11
-
12
-
13
-
14
-
15
-
16
-
 17
17 -
 18
18 -
 19
19 -
 20
20 -
 21
21 -
 22
22 -
 23
23 -
 24
24 -
 25
25 -
 26
26 -
 27
27 -
 28
28 -
 29
29 -
 30
30 -
 31
31 -
 32
32 -
 33
33 -
 34
34 -
 35
35 -
 36
36 -
 37
37 -
38
-
39
-
40
-
41
-
42
-
43
-
44
-
45
-
46
-
47
-
48
-
49
-
50
-
51
-
52
 |
 |

25
Best Buy Co., Inc. Fiscal 2000 Annual Report
Liquidity and Capital Resources
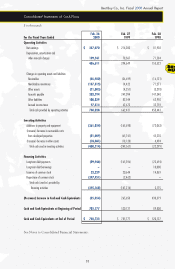
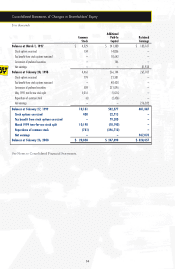
Record financial performance enabled the Company to internally fund its business expansion and repurchase
approximately $400 million of the Company’s common stock, while maintaining its liquidity and strong
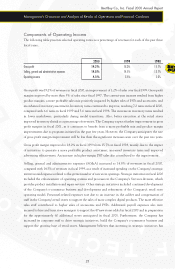
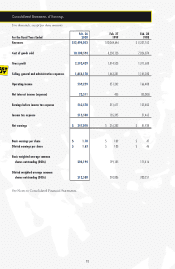
financial position. Cash flow from operations increased $98 million in fiscal 2000, to $760 million, driven
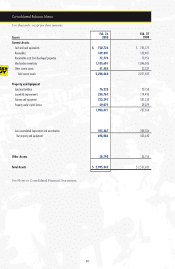
by earnings growth and continued improvement in inventory management. Cash and cash equivalents
totaled $751 million at the end of fiscal 2000, compared with $786 million at the end of fiscal 1999.
Inventories at the end of fiscal 2000 were $1.2 billion, up only 13% compared with one year ago, even with
a 24% sales increase, due to faster inventory turns. The increase in inventories was fully funded by an increase
in accounts payable.
Trade receivables, mainly credit card and vendor-related receivables, increased $57 million from one year ago.
The increase was primarily due to higher business volumes resulting from a 25% increase in fourth-quarter
sales and amounts due from ISP promotion subsidies. Receivables from sales on the Company’s private-label
credit card are sold to third parties, without recourse, and the Company does not bear any risk of loss with
respect to these receivables.
Other assets increased $23 million, with $16 million resulting from the Company’s strategic investments in
other companies made as part of its overall plan to expand its e-commerce business. Acquisition of leasehold
rights, the purchase of insurance policies in connection with the Company’s deferred compensation plan as
well as changes in deferred income taxes contributed to the net change in other assets.
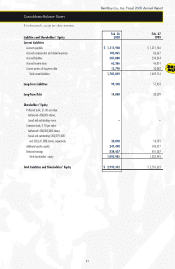
Accounts payable and accrued liabilities increased compared with fiscal 1999, due to higher business
volume. Accrued compensation and related liabilities increased versus one year ago as a result of expenses
associated with the expanding employee base supporting the Company’s growth. The increase in long-term
liabilities was primarily due to the increase in long-term deferred compensation and a net increase in
deferred revenue related to PSPs.
Debt declined $30 million in fiscal 2000 due to the repayment of an $18 million note and scheduled maturities
of capital leases and other loans.
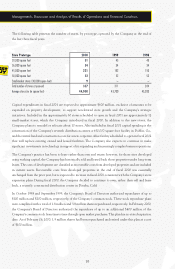
Capital spending in fiscal 2000 was $361 million, compared with $166 million and $72 million in fiscal 1999
and fiscal 1998, respectively. The Company expanded its store base by investing in 47 new stores and 13
remodeled or relocated stores during fiscal 2000, compared with 28 new stores and five remodeled or
relocated stores in fiscal 1999, and 13 new stores and five remodeled or relocated stores in fiscal 1998.
The Company increased its expansion program in fiscal 1999 after the initiatives to improve operations
resulted in an enhanced operating model and improved profitability. Capital spending in fiscal 2000 also
included the initial development for some of the stores scheduled to open in fiscal 2001. Additionally, the
Company expanded its corporate facilities to support the growth of the business, the most significant
investment being the purchase of an additional office building to supplement the Company’s corporate office.
The Company also continued to invest in new systems and technology to better position it for continued
growth and to generate improvements in its existing business.
Management’s Discussion and Analysis of Results of Operations and Financial Condition