Best Buy 2000 Annual Report Download - page 25
Download and view the complete annual report
Please find page 25 of the 2000 Best Buy annual report below. You can navigate through the pages in the report by either clicking on the pages listed below, or by using the keyword search tool below to find specific information within the annual report.-
 1
1 -
2
-
3
-
4
-
5
-
6
-
7
-
8
-
9
-
10
-
11
-
12
-
13
-
14
-
 15
15 -
 16
16 -
 17
17 -
 18
18 -
 19
19 -
 20
20 -
 21
21 -
 22
22 -
 23
23 -
 24
24 -
 25
25 -
 26
26 -
 27
27 -
 28
28 -
 29
29 -
 30
30 -
 31
31 -
 32
32 -
 33
33 -
 34
34 -
 35
35 -
36
-
37
-
38
-
39
-
40
-
41
-
42
-
43
-
44
-
45
-
46
-
47
-
48
-
49
-
50
-
51
-
52
 |
 |

23
Best Buy Co., Inc. Fiscal 2000 Annual Report
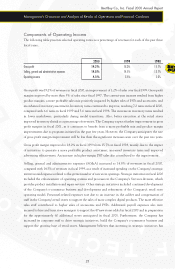
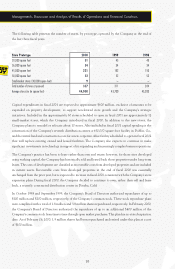
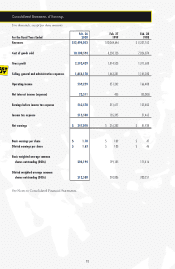
Components of Operating Income
The following table presents selected operating ratios as a percentage of revenues for each of the past three
fiscal years.
2000 1999 1998
Gross profit 19.2% 18.0% 15.7%
Selling, general and administrative expenses 14.8% 14.5% 13.7%
Operating income 4.3% 3.5% 2.0%
Gross profit was 19.2% of revenues in fiscal 2000, an improvement of 1.2% of sales over fiscal 1999. Gross profit
margins improved by more than 5% of sales since fiscal 1997. The current-year increase resulted from higher
product margins, a more profitable sales mix positively impacted by higher sales of PSPs and accessories, and
an enhanced inventory assortment. Inventory turns continued to improve, reaching 7.2 turns in fiscal 2000,
compared with 6.6 turns in fiscal 1999 and 5.6 turns in fiscal 1998. The increase in inventory turns resulted
in lower markdowns, particularly during model transitions. Also, better execution at the retail stores
improved inventory shrink as a percentage of revenues. The Company expects further improvement in gross
profit margins in fiscal 2001, as it continues to benefit from a more profitable mix and product margin
improvements due to programs initiated in the past few years. However, the Company anticipates the rate
of gross profit margin improvement will be less than the significant increases seen over the past two years.
Gross profit margin improved to 18.0% in fiscal 1999 from 15.7% in fiscal 1998, mainly due to the impact
of initiatives to generate a more profitable product assortment, increased inventory turns and improved
advertising effectiveness. An increase in higher-margin PSP sales also contributed to the improvement.
Selling, general and administrative expenses (SG&A) increased to 14.8% of revenues in fiscal 2000,
compared with 14.5% of revenues in fiscal 1999, as a result of increased spending on the Company’s strategic
initiatives and expenses related to the greater number of new store openings. Strategic initiatives in fiscal 2000
included the enhancement of operating systems and processes in the Company’s Services division, which
provides product installation and repair services. Other strategic initiatives included continued development
of the Company’s e-commerce business and development and refinement of the Company’s retail store
operating model. Personnel-related expenses rose due to an increase in the caliber and compensation of
staff in the Company’s retail stores to support the sales of more complex digital products. The more effective
sales staff contributed to higher sales of accessories and PSPs. Additional payroll expenses also were
incurred to hire and train store managers to support the 47 new stores added in fiscal 2000 and in preparation
for the approximately 60 additional stores anticipated in fiscal 2001. Furthermore, the Company has
increased its corporate staff to drive strategic initiatives, build the Company’s e-commerce business and
support the growing base of retail stores. Management believes that investing in strategic initiatives has
Management’s Discussion and Analysis of Results of Operations and Financial Condition