Bed, Bath and Beyond 2009 Annual Report Download - page 8
Download and view the complete annual report
Please find page 8 of the 2009 Bed, Bath and Beyond annual report below. You can navigate through the pages in the report by either clicking on the pages listed below, or by using the keyword search tool below to find specific information within the annual report.-
 1
1 -
 2
2 -
 3
3 -
 4
4 -
 5
5 -
 6
6 -
 7
7 -
 8
8 -
 9
9 -
 10
10 -
 11
11 -
 12
12 -
 13
13 -
 14
14 -
 15
15 -
 16
16 -
 17
17 -
 18
18 -
 19
19 -
20
-
21
-
22
-
23
-
24
-
25
-
26
-
27
-
28
-
29
-
30
-
31
-
32
-
33
-
34
-
35
-
36
-
37
-
38
-
39
-
40
-
41
-
42
-
43
-
44
-
45
-
46
-
47
-
48
-
49
-
50
-
51
-
52
-
53
-
54
-
55
-
56
-
57
-
58
-
59
-
60
-
61
-
62
-
63
-
64
-
65
-
66
-
67
-
68
 |
 |

BED BATH & BEYOND 2009 ANNUAL REPORT
6
MANAGEMENT’S DISCUSSION AND ANALYSIS OF FINANCIAL CONDITION AND RESULTS OF OPERATIONS
(continued)
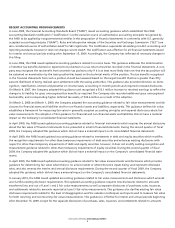
Income Taxes
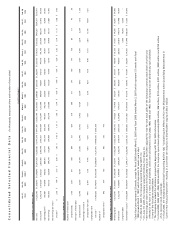
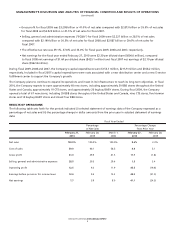
The effective tax rate was 39.1% for fiscal 2009, 37.8% for fiscal 2008 and 35.0% for fiscal 2007. For fiscal 2009, the tax rate
included an approximate $3.2 million provision primarily due to the recognition of certain discrete tax items partially offset by
the changing of the blended state tax rate of deferred income taxes. The remaining increase in the 2009 effective tax rate was
primarily due to slightly higher state taxes. For fiscal 2008, the tax rate included an approximate $0.8 million benefit primarily due
to the recognition of certain discrete tax items and the changing of the blended state tax rate of deferred income taxes.
The Company expects continued volatility in the effective tax rate from year to year because the Company is required each year
to determine whether new information changes the assessment of both the probability that a tax position will effectively be
sustained and the appropriateness of the amount of recognized benefit.
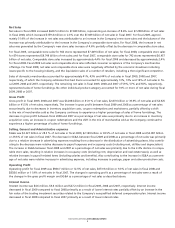
EXPANSION PROGRAM
The Company is engaged in an ongoing expansion program involving the opening of new stores in both new and existing mar-
kets, the expansion or relocation of existing stores and the continuous review of strategic acquisitions. In the 18 year period from
the beginning of fiscal 1992 to the end of fiscal 2009, the chain has grown from 34 to 1,100 stores. Total square footage grew
from 0.9 million square feet at the beginning of fiscal 1992 to 33.7 million square feet at the end of fiscal 2009. During fiscal
2009, the Company opened a total of 67 new stores, including 39 BBB stores throughout the United States and Canada, nine CTS
stores, five Harmon stores and 14 buybuy BABY stores, and closed four BBB stores, all of which resulted in the aggregate addi-
tion of approximately 1.7 million square feet of store space. In May 2008, the Company became a partner in a joint venture which
operates two stores in the Mexico City market under the name “Home & More.”
The Company plans to continue to expand its operations and invest in its infrastructure to reach its long term objectives. In fiscal
2010, the Company expects to open approximately 60 new stores, including approximately 30 BBB stores throughout the United
States and Canada, approximately 10 CTS stores and approximately 20 buybuy BABY stores.
LIQUIDITY AND CAPITAL RESOURCES
The Company has no outstanding bank borrowings and has been able to finance its operations, including its expansion program,
entirely through internally generated funds. For fiscal 2010, the Company believes that it will continue to finance its operations,
including its expansion program and planned capital expenditures, entirely through internally generated funds. Capital expendi-
tures for fiscal 2010, principally for new stores, existing store improvements, and information technology enhancements and other
projects, are planned to be approximately $225.0 million.
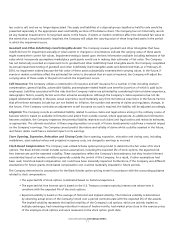
Fiscal 2009 compared to Fiscal 2008
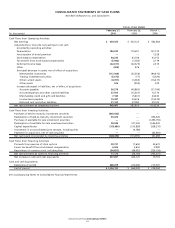
Net cash provided by operating activities in fiscal 2009 was $905.4 million, compared with $584.0 million in fiscal 2008. Year over
year, the Company experienced a decrease in cash used for the net components of working capital (primarily accounts payable,
accrued expenses and other current liabilities and income taxes payable, partially offset by merchandise inventories), and an
increase in net earnings.
Inventory per square foot was $52.15 as of February 27, 2010, an increase of approximately 1.8% from $51.24 as of February 28,
2009. The Company continues to focus on optimizing inventory productivity while maintaining appropriate in-store merchandise
levels to support sales.
Net cash used in investing activities in fiscal 2009 was $488.7 million, compared with $113.1 million in fiscal 2008. In fiscal 2009,
net cash used in investing activities was due to $335.0 million of purchases of investment securities, net of redemptions, and
$153.7 million of capital expenditures. In fiscal 2008, net cash used in investing activities was primarily due to $215.9 million of
capital expenditures partially offset by $107.6 million of redemptions of investment securities.
Net cash provided by financing activities in fiscal 2009 was $11.2 million, compared with net cash used in financing activities of
$26.8 million in fiscal 2008. The increase in net cash provided was primarily due to an $82.1 million increase in cash proceeds from
the exercise of stock options partially offset by a $46.8 million increase in common stock repurchases.