Bed, Bath and Beyond 2009 Annual Report Download - page 6
Download and view the complete annual report
Please find page 6 of the 2009 Bed, Bath and Beyond annual report below. You can navigate through the pages in the report by either clicking on the pages listed below, or by using the keyword search tool below to find specific information within the annual report.-
 1
1 -
 2
2 -
 3
3 -
 4
4 -
 5
5 -
 6
6 -
 7
7 -
 8
8 -
 9
9 -
 10
10 -
 11
11 -
 12
12 -
 13
13 -
 14
14 -
 15
15 -
 16
16 -
 17
17 -
18
-
19
-
20
-
21
-
22
-
23
-
24
-
25
-
26
-
27
-
28
-
29
-
30
-
31
-
32
-
33
-
34
-
35
-
36
-
37
-
38
-
39
-
40
-
41
-
42
-
43
-
44
-
45
-
46
-
47
-
48
-
49
-
50
-
51
-
52
-
53
-
54
-
55
-
56
-
57
-
58
-
59
-
60
-
61
-
62
-
63
-
64
-
65
-
66
-
67
-
68
 |
 |

BED BATH & BEYOND 2009 ANNUAL REPORT
4
MANAGEMENT’S DISCUSSION AND ANALYSIS OF FINANCIAL CONDITION AND RESULTS OF OPERATIONS
(continued)
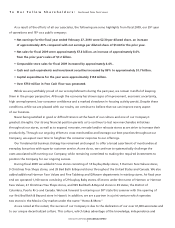
•Grossprotforscal2009was$3.208billionor41.0%ofnetsalescomparedwith$2.873billionor39.9%ofnetsales
for fiscal 2008 and $2.925 billion or 41.5% of net sales for fiscal 2007.
•Selling,generalandadministrativeexpenses(“SG&A”)forscal2009were$2.227billionor28.5%ofnetsales
compared with $2.199 billion or 30.5% of net sales for fiscal 2008 and $2.087 billion or 29.6% of net sales for
fiscal 2007.
•Theeffectivetaxratewas39.1%,37.8%and35.0%forscalyears2009,2008and2007,respectively.
•NetearningsforthescalyearendedFebruary27,2010were$2.30perdilutedshare($600.0million),compared
to fiscal 2008 net earnings of $1.64 per diluted share ($425.1 million) and fiscal 2007 net earnings of $2.10 per diluted
share ($562.8 million).
During fiscal 2009, 2008 and 2007, the Company’s capital expenditures were $153.7 million, $215.9 million and $358.2 million,
respectively. Included in fiscal 2007’s capital expenditures were costs associated with a new distribution center and a new E-service
fulfillment center to support the Company’s growth.
The Company plans to continue to expand its operations and invest in its infrastructure to reach its long term objectives. In fiscal
2010, the Company expects to open approximately 60 new stores, including approximately 30 BBB stores throughout the United
States and Canada, approximately 10 CTS stores, and approximately 20 buybuy BABY stores. During fiscal 2009, the Company
opened a total of 67 new stores, including 39 BBB stores throughout the United States and Canada, nine CTS stores, five Harmon
stores and 14 buybuy BABY stores and closed four BBB stores.
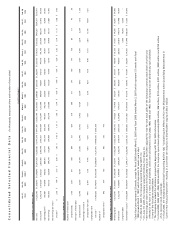
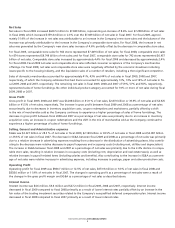
RESULTS OF OPERATIONS
The following table sets forth for the periods indicated (i) selected statement of earnings data of the Company expressed as a
percentage of net sales and (ii) the percentage change in dollar amounts from the prior year in selected statement of earnings
data:
Fiscal Year Ended
Percentage Percentage Change
of Net Sales from Prior Year
February 27, February 28, March 1, February 27, February 28,
2010 2009 2008 2010 2009
Net sales 100.0% 100.0% 100.0% 8.6% 2.3%
Cost of sales 59.0 60.1 58.5 6.6 5.1
Gross profit 41.0 39.9 41.5 11.7 (1.8)
Selling, general and administrative expenses 28.5 30.5 29.6 1.3 5.4
Operating profit 12.5 9.3 11.9 45.5 (19.6)
Earnings before provision for income taxes 12.6 9.5 12.3 44.2 (21.0)
Net earnings 7.7 5.9 8.0 41.1 (24.5)