Bed, Bath and Beyond 2009 Annual Report Download - page 7
Download and view the complete annual report
Please find page 7 of the 2009 Bed, Bath and Beyond annual report below. You can navigate through the pages in the report by either clicking on the pages listed below, or by using the keyword search tool below to find specific information within the annual report.-
 1
1 -
 2
2 -
 3
3 -
 4
4 -
 5
5 -
 6
6 -
 7
7 -
 8
8 -
 9
9 -
 10
10 -
 11
11 -
 12
12 -
 13
13 -
 14
14 -
 15
15 -
 16
16 -
 17
17 -
 18
18 -
19
-
20
-
21
-
22
-
23
-
24
-
25
-
26
-
27
-
28
-
29
-
30
-
31
-
32
-
33
-
34
-
35
-
36
-
37
-
38
-
39
-
40
-
41
-
42
-
43
-
44
-
45
-
46
-
47
-
48
-
49
-
50
-
51
-
52
-
53
-
54
-
55
-
56
-
57
-
58
-
59
-
60
-
61
-
62
-
63
-
64
-
65
-
66
-
67
-
68
 |
 |
BED BATH & BEYOND 2009 ANNUAL REPORT
5
Net Sales
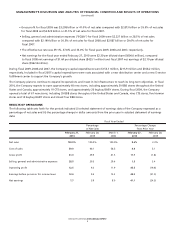
Net sales in fiscal 2009 increased $620.5 million to $7.829 billion, representing an increase of 8.6% over $7.208 billion of net sales
in fiscal 2008, which increased $159.4 million or 2.3% over the $7.049 billion of net sales in fiscal 2007. For fiscal 2009, approxi-
mately 51.4% of the increase in net sales was attributable to an increase in the Company’s new store sales and the balance of the
increase was primarily attributable to the increase in the Company’s comparable store sales. For fiscal 2008, the increase in net
sales was generated by the Company’s new store sales increase of 4.6% partially offset by the decrease in comparable store sales.
For fiscal 2009, comparable store sales for 942 stores represented $7.409 billion of net sales; for fiscal 2008, comparable store sales
for 874 stores represented $6.746 billion of net sales; and for fiscal 2007, comparable store sales for 792 stores represented $6.457
billion of net sales. Comparable store sales increased by approximately 4.4% for fiscal 2009 and decreased by approximately 2.4%
for fiscal 2008. Fiscal 2009 net sales and comparable store sales reflected consumer acceptance of the Company’s merchandise
offerings. For fiscal 2008, net sales and comparable store sales were negatively affected by the economic slowdown including
issues specific to the housing industry, and the liquidation sales of a number of retailers, including a then significant competitor.
Sales of domestics merchandise accounted for approximately 41%, 43% and 44% of net sales in fiscal 2009, 2008 and 2007,
respectively, of which the Company estimates that bed linens accounted for approximately 13%, 13% and 14% of net sales in fis-
cal 2009, 2008 and 2007, respectively. The remaining net sales in fiscal 2009, 2008 and 2007 of 59%, 57% and 56%, respectively,
represented sales of home furnishings. No other individual product category accounted for 10% or more of net sales during fiscal
2009, 2008 or 2007.
GrossProt
Gross profit in fiscal 2009, 2008 and 2007 was $3.208 billion or 41.0 % of net sales, $2.873 billion or 39.9% of net sales and $2.925
billion or 41.5% of net sales, respectively. The increase in gross profit between fiscal 2009 and 2008 as a percentage of net sales
was primarily due to decreases in inventory acquisition costs, coupon redemptions and markdowns, partially offset by a shift
in the mix of merchandise sold as the Company continues to experience a higher percentage of sales of home furnishings. The
decrease in gross profit between fiscal 2008 and 2007 as a percentage of net sales was primarily due to an increase in inventory
acquisition costs, an increase in coupon redemptions and the shift in the mix of merchandise sold as the Company continued to
experience a higher percentage of sales of home furnishings.
Selling,GeneralandAdministrativeexpenses
SG&A was $2.227 billion or 28.5 % of net sales in fiscal 2009, $2.199 billion or 30.5% of net sales in fiscal 2008 and $2.087 billion
or 29.6% of net sales in fiscal 2007. The decrease in SG&A between fiscal 2009 and 2008 as a percentage of net sales was primarily
due to a relative decrease in advertising expenses resulting from a decrease in the distribution of advertising pieces. Also contrib-
uting to the decrease were relative decreases in payroll expenses and occupancy costs (including rent, utilities and depreciation).
The increase in SG&A between fiscal 2008 and 2007 as a percentage of net sales was primarily due to the 2.4% decline in compa-
rable store sales, resulting in relative increases in occupancy costs (including rent, depreciation and real estate taxes), as well as
relative increases in payroll-related items (including salaries and benefits). Also contributing to the increase in SG&A as a percent-
age of net sales were relative increases in advertising expenses, including increases in postage, paper and other production costs.
OperatingProt
Operating profit for fiscal 2009 was $980.7 million or 12.5% of net sales, $673.9 million or 9.3% of net sales in fiscal 2008 and
$838.0 million or 11.9% of net sales in fiscal 2007. The changes in operating profit as a percentage of net sales were a result of
the changes in the gross profit margin and SG&A as a percentage of net sales as described above.
Interest Income
Interest income was $4.6 million, $9.4 million and $27.2 million in fiscal 2009, 2008 and 2007, respectively. Interest income
decreased in fiscal 2009 compared to fiscal 2008 primarily as a result of lower interest rates partially offset by an increase in the
fair value of the trading investment securities related to the Company’s nonqualified deferred compensation plan. Interest income
decreased in fiscal 2008 compared to fiscal 2007 primarily as a result of lower interest rates.