Bed, Bath and Beyond 2009 Annual Report Download - page 33
Download and view the complete annual report
Please find page 33 of the 2009 Bed, Bath and Beyond annual report below. You can navigate through the pages in the report by either clicking on the pages listed below, or by using the keyword search tool below to find specific information within the annual report.-
 1
1 -
2
-
3
-
4
-
5
-
6
-
7
-
8
-
9
-
10
-
11
-
12
-
13
-
14
-
15
-
16
-
17
-
18
-
19
-
20
-
21
-
22
-
 23
23 -
 24
24 -
 25
25 -
 26
26 -
 27
27 -
 28
28 -
 29
29 -
 30
30 -
 31
31 -
 32
32 -
 33
33 -
 34
34 -
 35
35 -
 36
36 -
 37
37 -
 38
38 -
 39
39 -
 40
40 -
 41
41 -
 42
42 -
 43
43 -
44
-
45
-
46
-
47
-
48
-
49
-
50
-
51
-
52
-
53
-
54
-
55
-
56
-
57
-
58
-
59
-
60
-
61
-
62
-
63
-
64
-
65
-
66
-
67
-
68
 |
 |

BED BATH & BEYOND 2009 ANNUAL REPORT
31
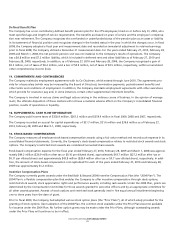
Restricted Stock
Restricted stock awards are issued and measured at fair market value on the date of grant and generally become exercisable in
five equal annual installments beginning one to three years from the date of grant. Vesting of restricted stock awarded to
certain of the Company’s executives is dependent on the Company’s achievement of a performance-based test for the fiscal year
of grant, and assuming achievement of the performance-based test, time vesting, subject, in general, to the executive remain-
ing in the Company’s employ on specified vesting dates. The Company recognizes compensation expense related to these awards
based on the assumption that the performance-based test will be achieved. Vesting of restricted stock awarded to the Company’s
other employees is based solely on time vesting.
Changes in the Company’s restricted stock for the fiscal year ended February 27, 2010 were as follows:
Weighted Average
Number of Grant-Date
(Shares in thousands) Restricted Shares Fair Value
Unvested restricted stock, beginning of period 3,624 $ 35.79
Granted 1,510 28.93
Vested (547) 36.11
Forfeited (141) 33.64
Unvested restricted stock, end of period 4,446 $ 33.49
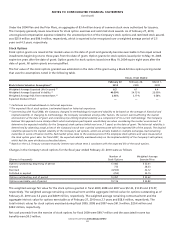
14. SUMMARY OF QUARTERLY RESULTS (UNAUDITED)
FISCAL 2009
(in thousands, except per share data) QUARTER ENDED
May 30, August 29, November 28, February 27,
2009 2009 2009 2010
Net sales $ 1,694,340 $ 1,914,909 $ 1,975,465 $ 2,244,079
Gross profit 666,818 773,393 812,412 955,496
Operating profit 142,304 222,031 245,611 370,741
Earnings before provision for income taxes 144,071 223,507 246,348 371,329
Provision for income taxes 56,899 87,976 95,060 145,287
Net earnings $ 87,172 $ 135,531 $ 151,288 $ 226,042
EPS-Basic (1) $ 0.34 $ 0.53 $ 0.59 $ 0.88
EPS-Diluted (1) $ 0.34 $ 0.52 $ 0.58 $ 0.86
FISCAL 2008
(in thousands, except per share data) QUARTER ENDED
May 31, August 30, November 29, February 28,
2008 2008 2008 2009
Net sales $ 1,648,491 $ 1,853,892 $ 1,782,683 $ 1,923,274
Gross profit 656,000 739,321 692,857 785,058
Operating profit 118,819 187,421 136,374 231,282
Earnings before provision for income taxes 123,349 190,367 137,770 231,822
Provision for income taxes 46,572 71,099 50,070 90,444
Net earnings $ 76,777 $ 119,268 $ 87,700 $ 141,378
EPS-Basic (1) $ 0.30 $ 0.46 $ 0.34 $ 0.55
EPS-Diluted (1) $ 0.30 $ 0.46 $ 0.34 $ 0.55
(1) Net earnings per share (“EPS”) amounts for each quarter are required to be computed independently and may not equal
the amount computed for the total year.