Bed, Bath and Beyond 2009 Annual Report Download - page 26
Download and view the complete annual report
Please find page 26 of the 2009 Bed, Bath and Beyond annual report below. You can navigate through the pages in the report by either clicking on the pages listed below, or by using the keyword search tool below to find specific information within the annual report.-
 1
1 -
2
-
3
-
4
-
5
-
6
-
7
-
8
-
9
-
10
-
11
-
12
-
13
-
14
-
15
-
 16
16 -
 17
17 -
 18
18 -
 19
19 -
 20
20 -
 21
21 -
 22
22 -
 23
23 -
 24
24 -
 25
25 -
 26
26 -
 27
27 -
 28
28 -
 29
29 -
 30
30 -
 31
31 -
 32
32 -
 33
33 -
 34
34 -
 35
35 -
 36
36 -
37
-
38
-
39
-
40
-
41
-
42
-
43
-
44
-
45
-
46
-
47
-
48
-
49
-
50
-
51
-
52
-
53
-
54
-
55
-
56
-
57
-
58
-
59
-
60
-
61
-
62
-
63
-
64
-
65
-
66
-
67
-
68
 |
 |

BED BATH & BEYOND 2009 ANNUAL REPORT
24
NOTES TO CONSOLIDATED FINANCIAL STATEMENTS
(continued)
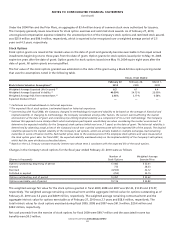
approach, income approach and/or cost approach. The Company’s Level 1 valuations are based on the market approach and con-
sist primarily of quoted prices for identical items on active securities exchanges. The Company’s Level 3 valuations of auction rate
securities are based on the income approach, specifically, discounted cash flow analyses which utilize significant inputs based on
the Company’s estimates and assumptions. Inputs include current coupon rates and expected maturity dates.
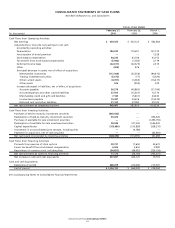
The following table presents the valuation of the Company’s financial assets as of February 27, 2010 measured at fair value
on a recurring basis by input level:
Quoted Prices Significant
in Active Markets Unobservable
for Identical Assets Inputs
(in millions) (Level 1) (Level 3) Total
Short term – available-for-sale securities:
Auction rate securities $ — $ 15.0 $ 15.0
Short term – trading securities:
Auction rate securities — 40.5 40.5
Short term – put option — 2.3 2.3
Long term – available-for-sale securities:
Auction rate securities — 120.8 120.8
Long term – trading securities:
Nonqualified deferred compensation plan assets 12.1 — 12.1
Total $ 12.1 $ 178.6 $ 190.7
The following table presents the changes in the Company’s financial assets that are measured at fair value on a recurring basis
using significant unobservable inputs (Level 3):
Total Significant
Auction Rate Unobservable
(in millions) Securities Put Option Inputs (Level 3)
Balance on February 28, 2009, net of temporary valuation adjustment $ 212.8 $ 1.8 $ 214.6
Change in temporary valuation adjustment included in accumulated
other comprehensive income (loss) 0.5 — 0.5
Unrealized loss included in earnings (1) (0.5) — (0.5)
Change in valuation of Put Option — 0.5 0.5
Redemptions at par (36.5) — (36.5)
Balance on February 27, 2010, net of temporary valuation adjustment $ 176.3 $ 2.3 $ 178.6
(1) Represents the amount of total losses for the period included in earnings relating to assets still held on February 27, 2010.
Subsequent to the end of fiscal 2009 through April 22, 2010, the Company additionally redeemed approximately $14.1 million
of short term available-for-sale securities at par.
6. INVESTMENT SECURITIES
The Company’s investment securities as of February 27, 2010 and February 28, 2009 are as follows:
February 27, February 28,
(in millions) 2010 2009
Available-for-sale securities:
Short term $ 15.0 $ 2.0
Long term 120.8 171.4
Trading securities:
Short term 40.5 —
Long term 12.1 47.8
Held-to-maturity securities:
Short term 373.6 —
Long term — 0.1
Put option:
Short term 2.3 —
Long term — 1.8
Total investment securities $ 564.3 $ 223.1