Anthem Blue Cross 2000 Annual Report Download - page 7
Download and view the complete annual report
Please find page 7 of the 2000 Anthem Blue Cross annual report below. You can navigate through the pages in the report by either clicking on the pages listed below, or by using the keyword search tool below to find specific information within the annual report.-
 1
1 -
 2
2 -
 3
3 -
 4
4 -
 5
5 -
 6
6 -
 7
7 -
 8
8 -
 9
9 -
 10
10 -
 11
11 -
 12
12 -
 13
13 -
 14
14 -
 15
15 -
 16
16 -
 17
17 -
 18
18 -
19
-
20
-
21
-
22
-
23
-
24
-
25
-
26
-
27
-
28
 |
 |

5
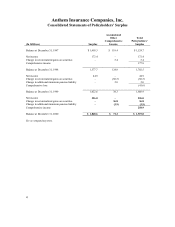
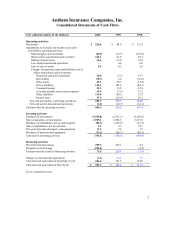
Anthem Insurance Companies, Inc.
Consolidated Statements of Cash Flows
Year ended December 31 (In Millions)2000 1999 1998
Operating activities
Net income $ 226.0 $ 44.9 $ 172.4
Adjustments to reconcile net income to net cash
provided by operating activities:
Realized gains on investments (25.9) (37.5) (155.9)
Depreciation, amortization and accretion 102.1 61.8 58.3
Deferred income taxes 36.6 23.0 32.0
Loss from discontinued operations –6.0 6.0
Loss on sale of assets 0.5 0.2 2.6
Changes in operating assets and liabilities, net of
effect of purchases and divestitures:
Restricted cash and investments 10.0 (2.1) 93.7
Receivables (70.7) 6.0 (76.8)
Other assets 25.3 80.7 (31.4)
Policy liabilities 124.1 105.6 (40.3)
Unearned income 22.3 15.9 22.8
Accounts payable and accrued expenses 69.9 (7.5) 27.2
Other liabilities 119.0 (40.1) 23.3
Income taxes 47.5 (20.4) 10.1
Net cash provided by continuing operations 686.7 236.5 144.0
Net cash used in discontinued operations (2.2) (16.7) (24.1)
Cash provided by operating activities 684.5 219.8 119.9
Investing activities
Purchases of investments (3,544.8) (2,331.1) (3,286.8)
Sales or maturities of investments 2,925.2 2,308.3 3,217.2
Purchases of subsidiaries, net of cash acquired (85.1) (246.8) (35.2)
Sales of subsidiaries, net of cash sold 5.4 2.3 79.3
Proceeds from sale of property and equipment 11.5 7.2 5.9
Purchases of property and equipment (73.3) (96.7) (89.2)
Cash used in investing activities (761.1) (356.8) (108.8)
Financing activities
Proceeds from borrowings 295.9 220.1 0.4
Payments on borrowings (220.4) –(4.2)
Cash provided by (used in) financing activities 75.5 220.1 (3.8)
Change in cash and cash equivalents (1.1) 83.1 7.3
Cash and cash equivalents at beginning of year 204.4 121.3 114.0
Cash and cash equivalents at end of year $ 203.3 $ 204.4 $ 121.3
See accompanying notes.