Anthem Blue Cross 2000 Annual Report Download - page 22
Download and view the complete annual report
Please find page 22 of the 2000 Anthem Blue Cross annual report below. You can navigate through the pages in the report by either clicking on the pages listed below, or by using the keyword search tool below to find specific information within the annual report.-
 1
1 -
2
-
3
-
4
-
5
-
6
-
7
-
8
-
9
-
10
-
11
-
 12
12 -
 13
13 -
 14
14 -
 15
15 -
 16
16 -
 17
17 -
 18
18 -
 19
19 -
 20
20 -
 21
21 -
 22
22 -
 23
23 -
 24
24 -
 25
25 -
 26
26 -
 27
27 -
 28
28
 |
 |

20
Anthem Insurance Companies, Inc.
Notes to Consolidated Financial Statements (continued)
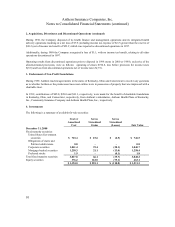
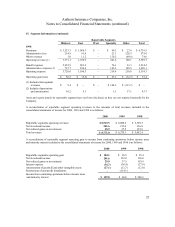
13. Retirement Benefits (continued)
The weighted average assumptions used in calculating the accrued liabilities for all plans are as follows:
Pension Benefits Other Benefits
2000 1999 1998 2000 1999 1998
Discount rate 7.50% 7.50% 6.75% 7.50% 7.50% 6.75%
Rate of compensation increase 4.50% 4.50% 4.50% 4.50% 4.50% 4.50%
Expected rate of return on plan assets 9.00% 9.00% 9.55% 6.27% 6.50% 6.50%
The assumed health care cost trend rate used in measuring the other benefit obligations is generally 6% in 2000 and
is assumed to decrease to 5% in 2001, and remain level thereafter. For 1999, the rates were generally 7%
decreasing by 1% per year, to 5% in 2001.
The health care cost trend rate assumption can have a significant effect on the amounts reported. A one-percentage-
point change in assumed health care cost trend rates would have the following effects:
1-Percentage
Point Increase
1-Percentage
Point Decrease
Effect on total of service and interest cost components $ 0.4 $ (0.4)
Effect on the postretirement benefit obligation 5.2 (4.3)
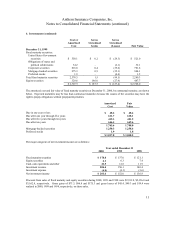
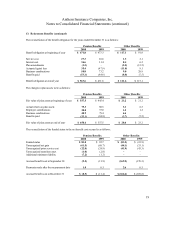
Below are the components of net periodic benefit cost:
Pension Benefits Other Benefits
2000 1999 1998 2000 1999 1998
Service cost $ 27.3 $ 26.6 $ 27.5 $ 1.3 $ 2.1 $ 2.5
Interest cost 36.6 31.4 32.2 8.4 6.2 6.9
Expected return on assets (49.9) (39.6) (42.2) (1.4) (1.2) (1.2)
Recognized actuarial (gain) loss 2.8 1.2 0.3 (1.7) (2.4) (2.1)
Amortization of prior service cost (3.3) (3.3) (3.6) (6.5) (5.4) (5.6)
Amortization of transition asset (1.7) (2.0) (2.1) –– –
Net periodic benefit cost before curtailments 11.8 14.3 12.1 0.1 (0.7) 0.5
Net settlement/curtailment credit –(7.9) (3.3) ––(5.4)
Net periodic benefit cost (credit) $ 11.8 $ 6.4 $ 8.8 $ 0.1 $ (0.7) $ (4.9)
The net settlement/curtailment credits in 1999 and 1998 result from the divestitures of several non-core businesses as
previously discussed in Note 2.
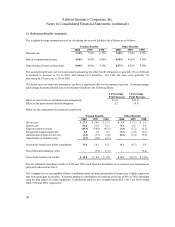
The Company has several qualified defined contribution plans covering substantially all employees. Eligible employees
may only participate in one plan. Voluntary employee contributions are matched at the rate of 40% to 50% depending
upon the plan subject to certain limitations. Contributions made by the Company totaled $10.3, $8.7 and $10.0 during
2000, 1999 and 1998, respectively.